Question 7:
Diagram below is an incomplete pictograph showing the sales of books for a duration of five months.
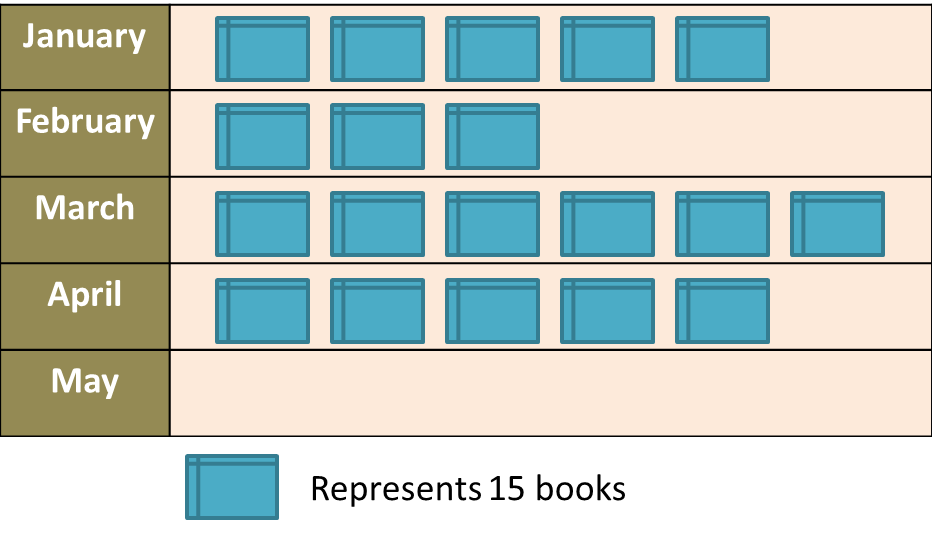
(a) The sales in May is ¼ of the total sales in January and February.
Complete the pictograph in the Diagram.
(b) Find the total number of books sold before April.
Solution:
(a)
(b)
Total number of books sold before April
= (5 + 3 + 6) × 15
= 14 × 15
= 210
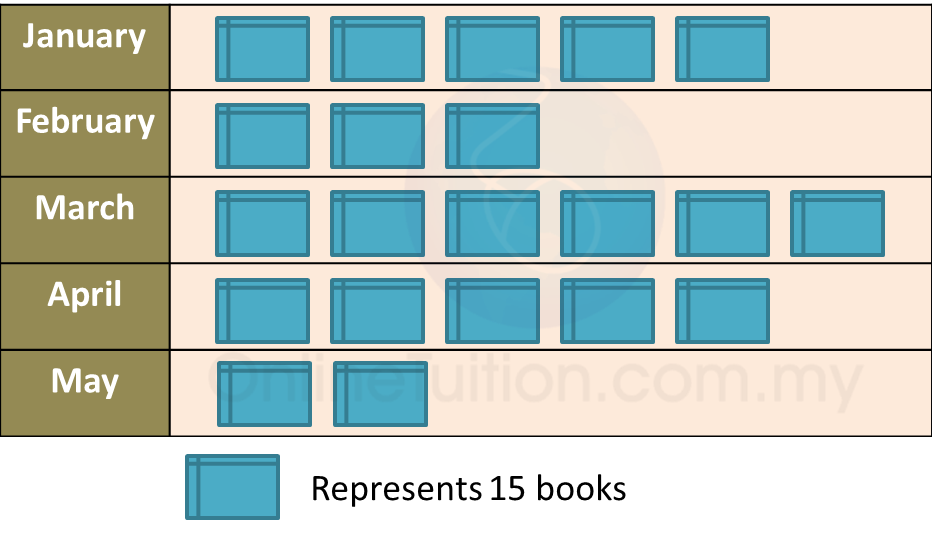
Diagram below is an incomplete pictograph showing the sales of books for a duration of five months.
(a) The sales in May is ¼ of the total sales in January and February.
Complete the pictograph in the Diagram.
(b) Find the total number of books sold before April.
Solution:
(a)
(b)
Total number of books sold before April
= (5 + 3 + 6) × 15
= 14 × 15
= 210
Question 8:
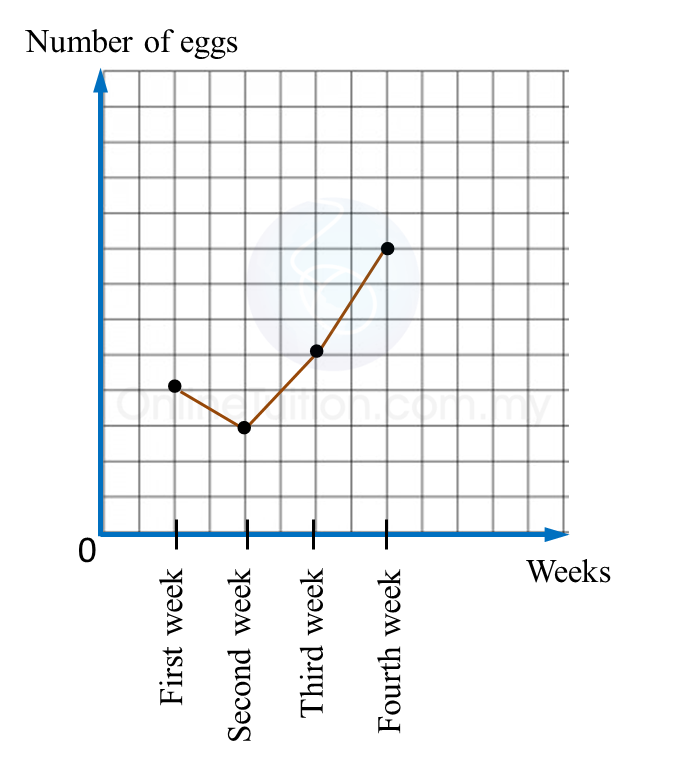
Diagram below shows an incomplete line graph of the number of eggs sold in four weeks. The number of eggs sold on week 1 is 2000 and 4000 on week 4.
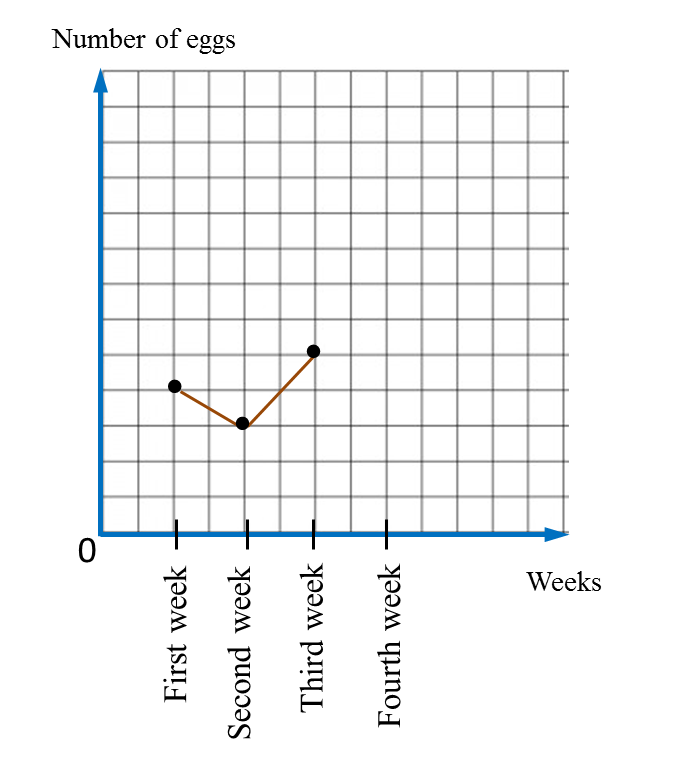
(a) Complete the line graph in the Diagram.
(b) Complete the pie chart in the second Diagram to represent sales from Week 1 to Week 4.
Solution:
(a)
(b)
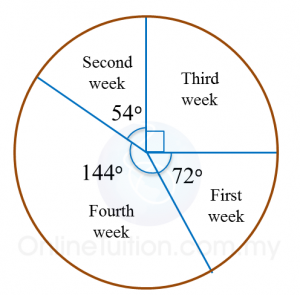
Diagram below shows an incomplete line graph of the number of eggs sold in four weeks. The number of eggs sold on week 1 is 2000 and 4000 on week 4.
(a) Complete the line graph in the Diagram.
(b) Complete the pie chart in the second Diagram to represent sales from Week 1 to Week 4.
Solution:
(a)
(b)