6.2 Quantity Represented by the Area under a Graph (Part 1)
1. In the speed-time graph,
(a) Quantity represented by the gradient of the graph is acceleration or the rate of change of speed.
(b) Quantity represented by the area under the graph is distance.
Example 1:
Calculate the distance of each of the following graphs.
(a)
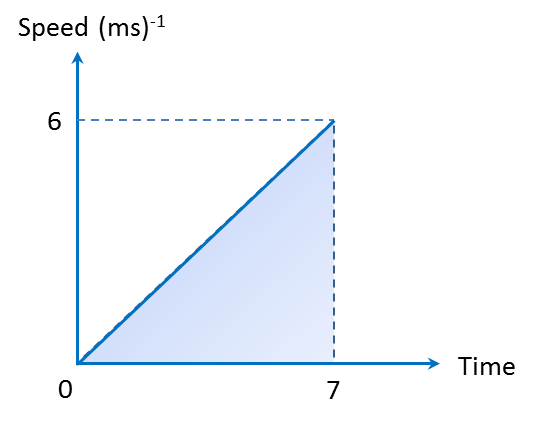
Distance = Area under the speed-time graph = Area of a triangle
(b)
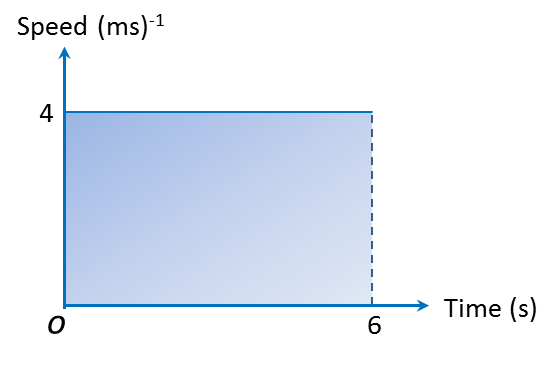
Distance = Area under the speed-time graph = Area of a rectangle
Distance = Length × Breadth
= 6 × 4 = 24 m
(c)
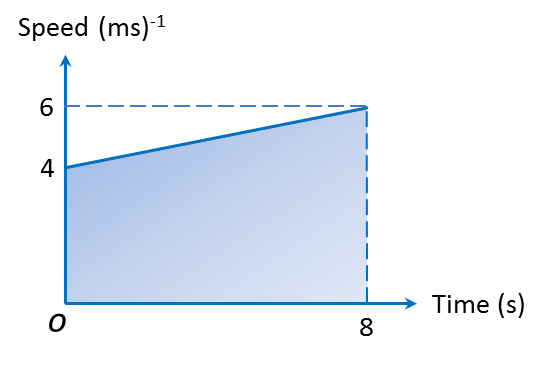
(c)
Distance = Area under the speed-time graph = Area of a trapezium