Question 4:
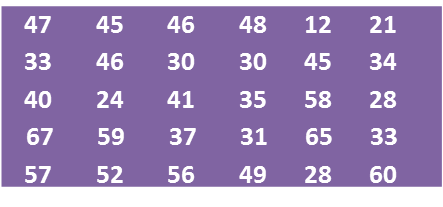
Diagram below shows the marks obtained by a group of 30 students in a Science test.
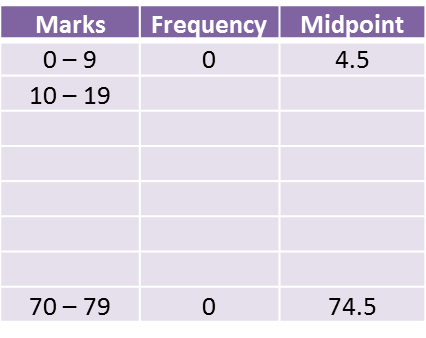
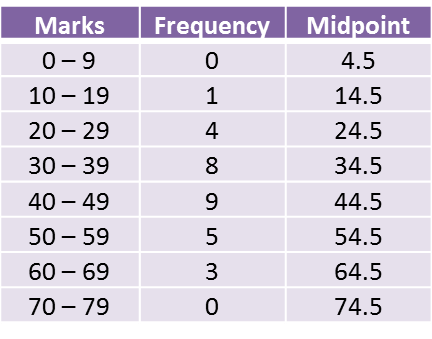
(a) Based on the data in diagram above, complete the table in the answer space.
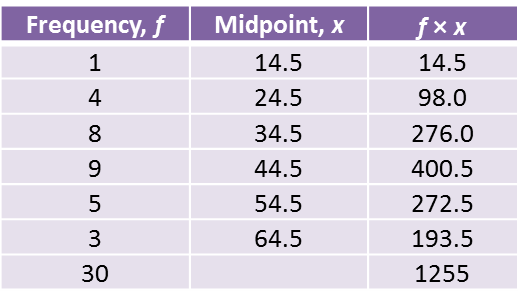
(b) Based on the completed table in part (a), calculate the estimated mean mark of a student.
For this part of the question, use graph paper.
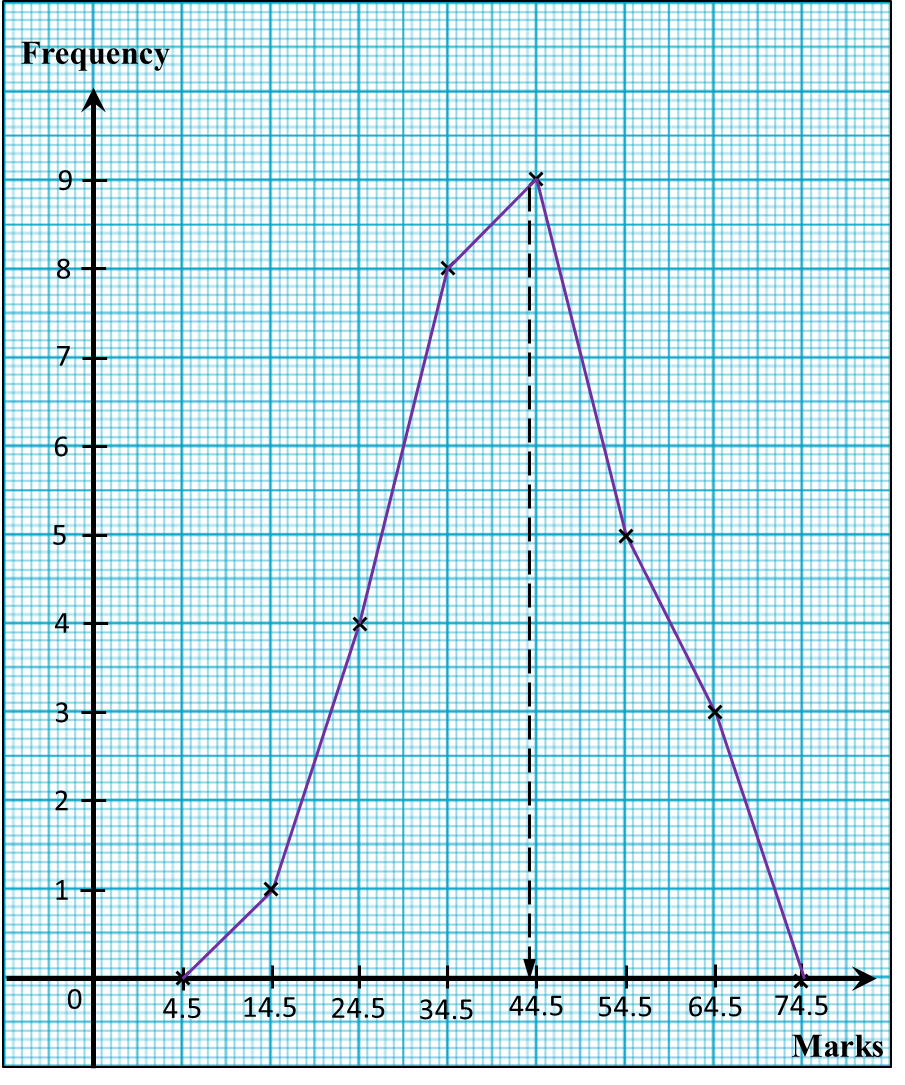
(c) By using a scale of 2 cm to 10 marks on the horizontal axis and 2 cm to 1 student on the vertical axis, draw a frequency polygon for the data.
(d) The passing mark for the test is 44. Using the frequency polygon drawn in part (c), find the number of students who passed the test.
Answer:
Solution:
(a)
(b)
(c)
(d)
Number of students who passed the test
= 9 + 5 + 3
= 17
Diagram below shows the marks obtained by a group of 30 students in a Science test.
(a) Based on the data in diagram above, complete the table in the answer space.
(b) Based on the completed table in part (a), calculate the estimated mean mark of a student.
For this part of the question, use graph paper.
(c) By using a scale of 2 cm to 10 marks on the horizontal axis and 2 cm to 1 student on the vertical axis, draw a frequency polygon for the data.
(d) The passing mark for the test is 44. Using the frequency polygon drawn in part (c), find the number of students who passed the test.
Answer:
Solution:
(a)
(b)
(c)
(d)
Number of students who passed the test
= 9 + 5 + 3
= 17