Question 12 (5 marks):
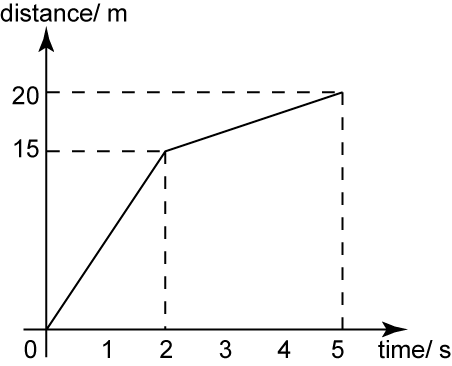
Diagram 7 shows a distance-time graph for the journey of a car from Kuala Lumpur to Ipoh.
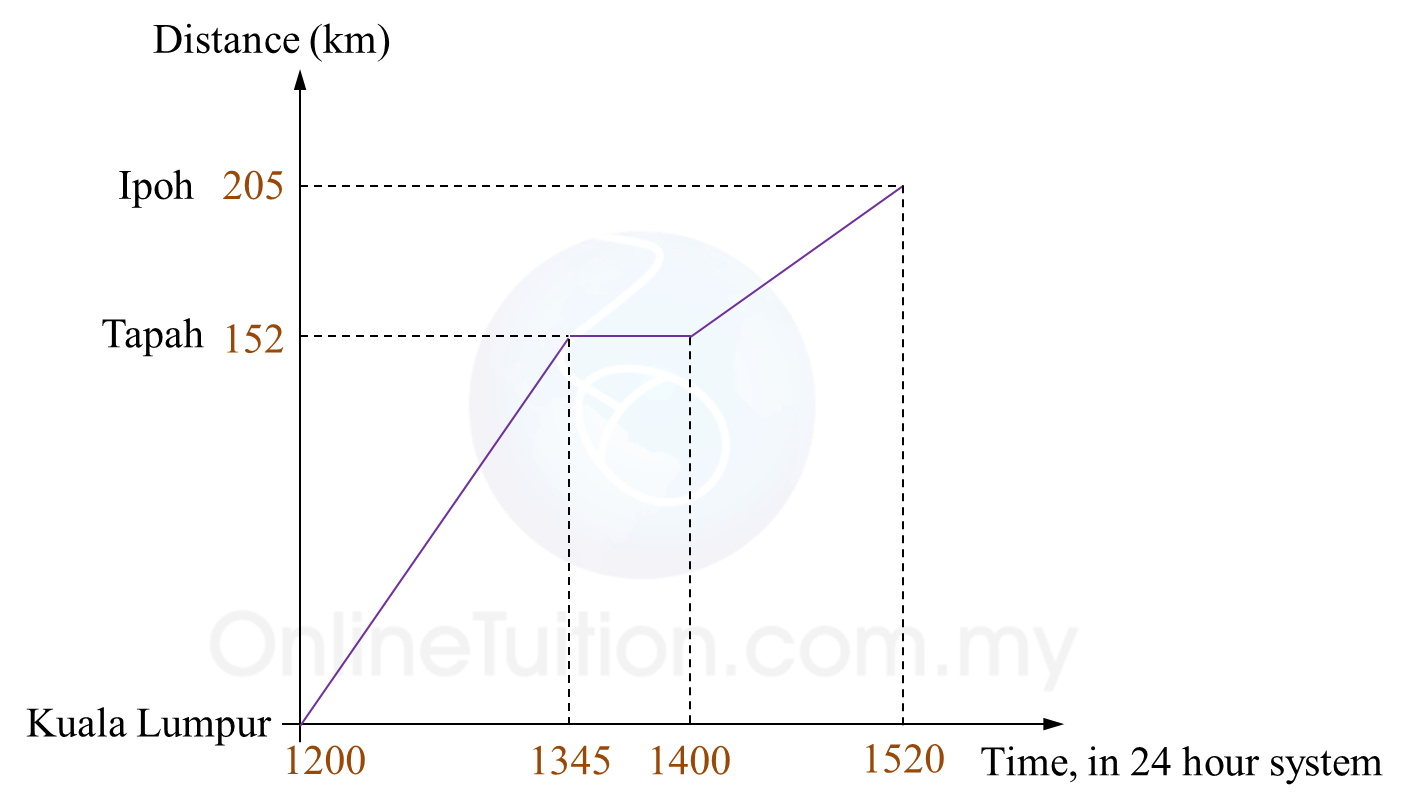
(a) State the duration of time, in minutes, the driver stopped and rest at Tapah.
(b) Calculate the speed, in kmh-1, of the car from Kuala Lumpur to Tapah.
(c) Calculate the average speed, in kmh-1, of the car for whole journey.
Solution:
(a)
1400 – 1345 = 15 minutes
The driver stopped and rest at Tapah for 15 minutes.
(b)
(c)
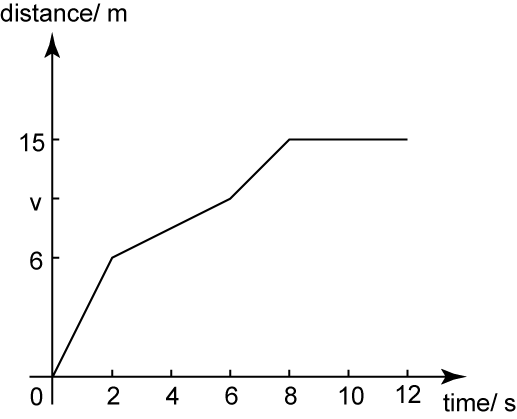
Diagram 7 shows a distance-time graph for the journey of a car from Kuala Lumpur to Ipoh.
(a) State the duration of time, in minutes, the driver stopped and rest at Tapah.
(b) Calculate the speed, in kmh-1, of the car from Kuala Lumpur to Tapah.
(c) Calculate the average speed, in kmh-1, of the car for whole journey.
Solution:
(a)
1400 – 1345 = 15 minutes
The driver stopped and rest at Tapah for 15 minutes.
(b)
(c)
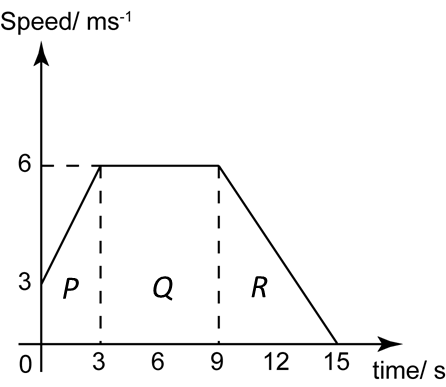
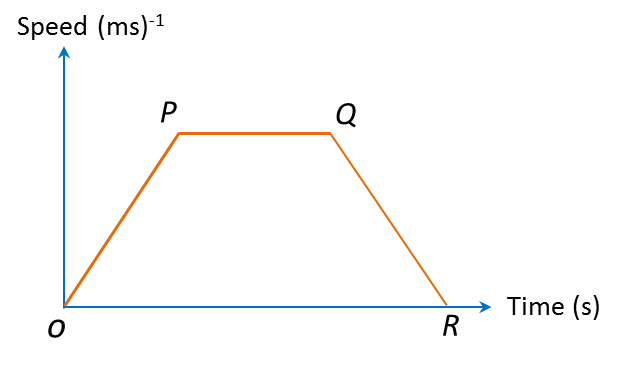
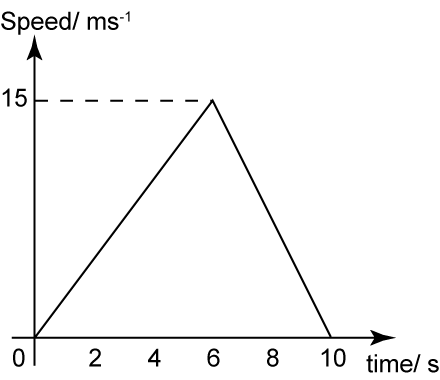
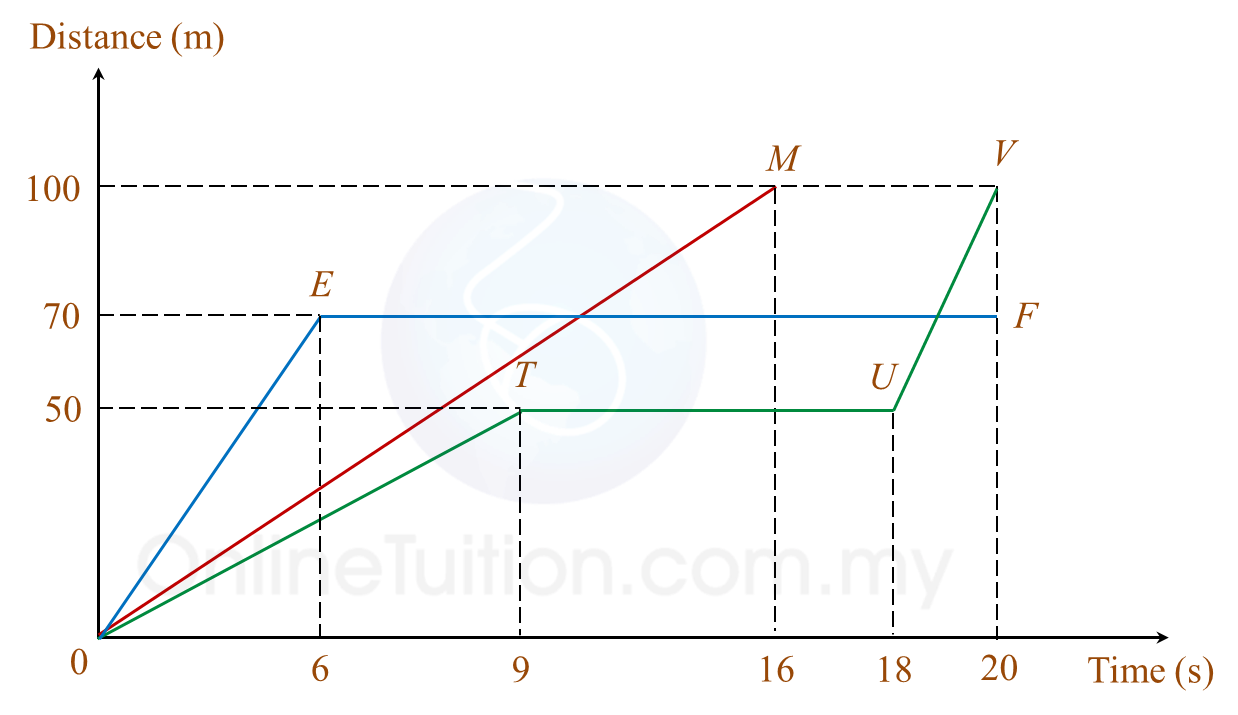 Diagram 6
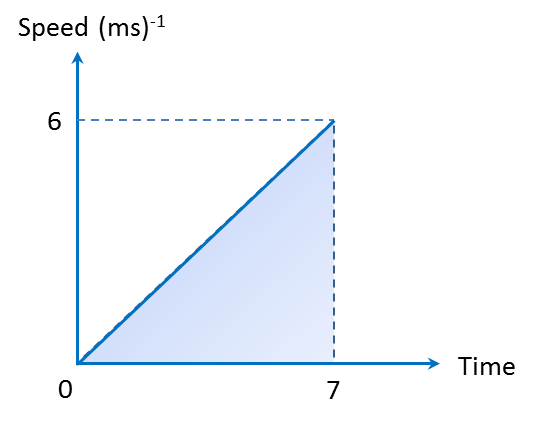
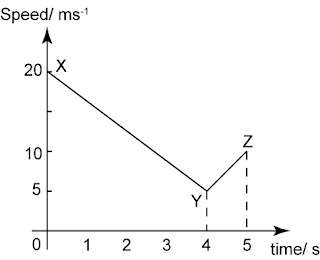
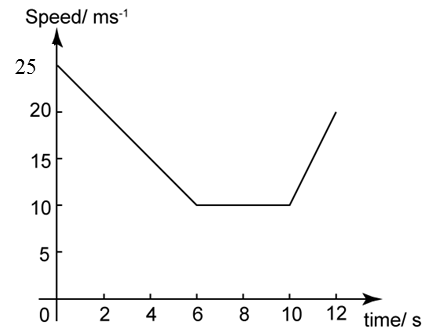
 Diagram 11