Combination of Graphs
Example 2:
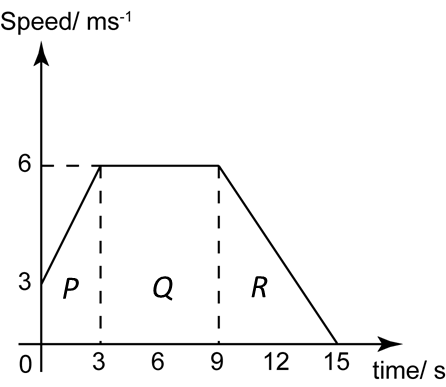
The diagram above shows the speed-time graph of a moving object for 15 seconds.
(a) State the length of time, in s, that the particle moves with constant speed.
(b) Calculate the rate of change of speed, in ms-2, in the first 3 seconds.
(c) Calculate the average speed of the object in 15 seconds.
Solution:
(a)
Length of time that the particle moves with constant speed
= 9 – 3 = 6 s
(b)
Rate of change of speed in the first 3 seconds
= acceleration = gradient
=y2−y1x2−x1=6−33−0=1ms−2
(c)
Total distance travelled of the object in 15 seconds
= Area under the graph in the 15 seconds
= Area P + Area Q + Area R
=[12(3+6)×3]+[(9−3)×6]+[12(15−9)×6]=13.5+36+18=67.5 m
Average speed of the object in 15 seconds
=Total distance travelledTotal time taken=67.515=4.5 ms−1