Oscillation
- Waves are formed by a series of oscillation.
- In order to understand waves, we must understand oscillation.
Technical Terms Related to Oscillation
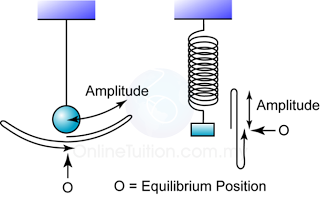
- An equilibrium position is a point where an oscillating object experiences zero resultant forces.
- A complete oscillation occurs when the vibrating object:
- moves to and fro from its original position and
- moves in the same direction as its original motion.

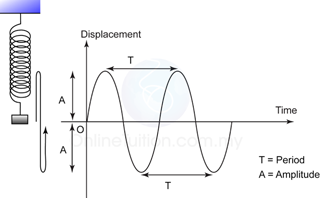
- Amplitude is the maximum amplitude of an object from its equilibrium position. The SI unit for amplitude is meter, m.
- The greater the amplitude, the greater the mechanical energy possessed by the oscillating system.
- Period is defined as the time required for one complete oscillation or vibration .
- Frequency, f is the number of oscillation that take place in one second. The SI unit for frequency is Herz (Hz).
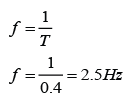
- Frequency can be related to period by the following equation
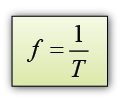
f = frequency
T = Period
Example:
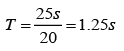
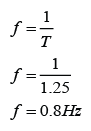
Given that a pendulum makes 20 oscillations in 25s. Find the frequency of the pendulum.
Answer:
Period,
Frequency
- The displacement of the oscillating object at any time.
- The amplitude
- The period.
Example:
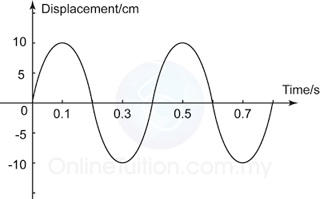
Figure above shows a displacement versus time graph for a vibrating object.
a. Find the amplitude, period and frequency for the vibrating system.
b. What is the displacement of the object at t = 0.3 s,
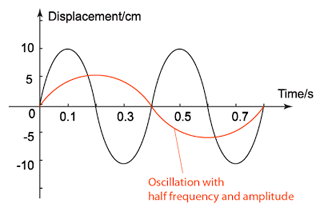
c. Sketch in the same axis above, a graph of a wave which the frequency and amplitude are half of the wave in the figure above.
Answer:
a.
The amplitude, A = 10cm
The period, T = 0.4s
The frequency,
b. The displacement at 0.3s = -10cm
c.
Comparing Displacement-Time Graph and Displacement- Distance Graph
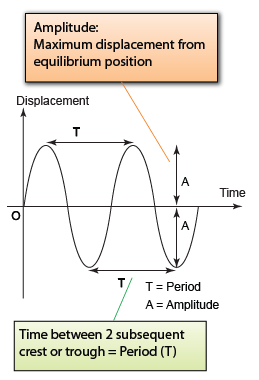 |
| (Displacement-time graph - Graph of oscillation) |
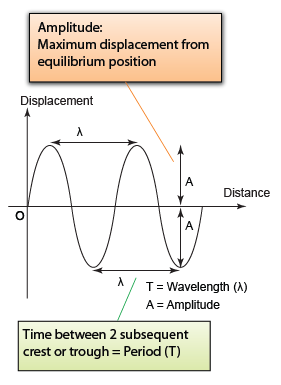 |
| (Displacement-distance graph - Graph of Waves) |
- Both the displacement-time graph and the displacement distance graph looked similar. However they are 2 different types of graph.
- The displacement-time graph illustrate the displacement of an object over time whereas the displacement-distance graph tell the position of the vibrating particles of a wave.
- For a displacement- distance graph, the distance between 2 crest/trough represent the period whereas for the displacement-distance graph, it represents the wavelength.