8.1 Radians
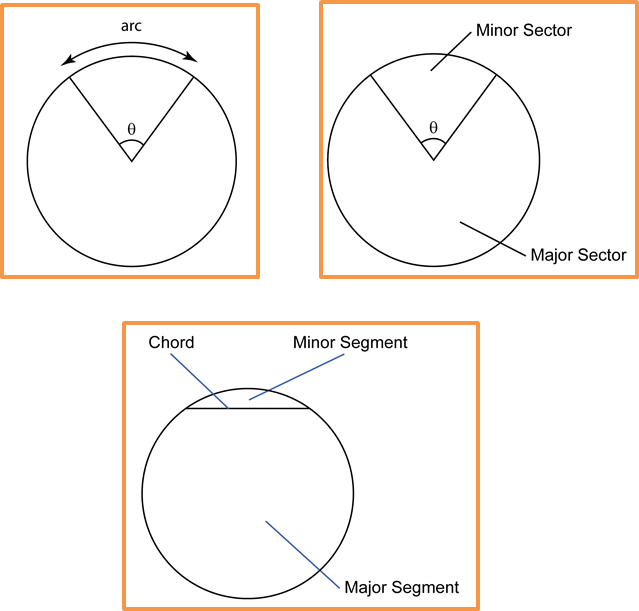
(A) Terminology:
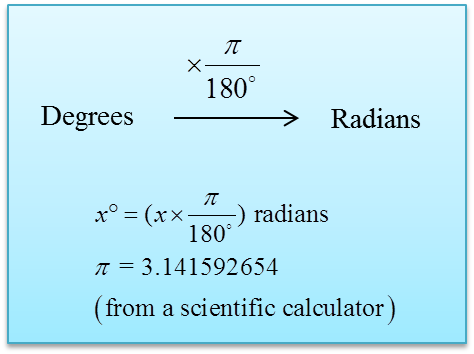
(B) Convert degrees to radians:
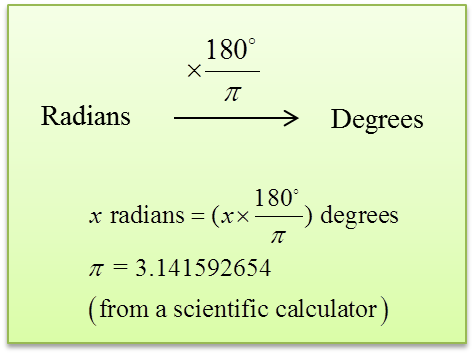
(C) Convert radians to degrees:
(A) Terminology:
(B) Convert degrees to radians:
(C) Convert radians to degrees:

Number of child |
2 |
3 |
4 |
5 |
6 |
7 |
8 |
Frequency |
6 |
8 |
5 |
3 |
3 |
3 |
2 |
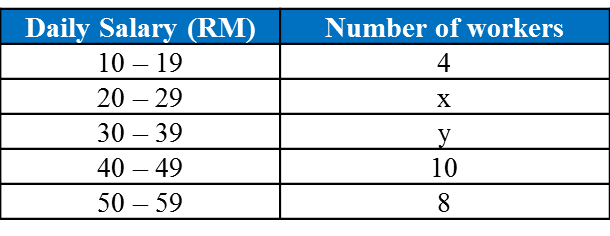
Daily Salary(RM) |
Number of workers |
10 – 14 |
40 |
15 – 19 |
25 |
20 – 24 |
15 |
25 – 29 |
12 |
30 – 34 |
8 |
Daily Salary (RM) |
Number of workers, f |
Midpoint, x |
fx |
fx2 |
10 – 14 |
40 |
12 |
480 |
5760 |
15 – 19 |
25 |
17 |
425 |
7225 |
20 – 24 |
15 |
22 |
330 |
7260 |
25 – 29 |
12 |
27 |
324 |
8748 |
30 – 34 |
8 |
32 |
256 |
8192 |
Total |
100 |
1815 |
37185 |