3.1b Determining the Image of an Object under Combination of (a) Two Enlargements or (b) an Enlargement and an Isometric Transformation


3.1b Determining the Image of an Object under Combination of (a) Two Enlargements or (b) an Enlargement and an Isometric Transformation
 
1. Enlargement is a transformation where all points of an object on a plane move from a fixed point at a constant ratio.
 
2. The fixed point is called the centre of enlargement and constant ratio is called the scale factor.

Scale factor, = Length of image side Length of object side


3. For enlargement, the object and the image are similar.
 
4. Area of image = (Scale factor)2 × Area of object

= k2 × Area of object


Example:


E, P and T are three transformations that are defined as follows:
= Enlargement with centre V (0, –1) and a scale factor of 2.
= Reflection at the line = –1.
T r a n s l a t i o n ( 3 3 )
Based on the diagram above, determine the image of the shaded figure under the combined transformations
(a) E2  (b) ET (c) EP
 

Solution:


(a)
Shaded figure → (E) figure III → (E) figure D.
Hence, the image of the shaded figure under the combined transformation E= EE is the figure D.
 
(b)
Shaded figure → (T) figure II → (E) figure A.
Hence, the image of the shaded figure under the combined transformation ET is the figure A.
 
(c)
Shaded figure → (P) figure I → (E) figure B.
Hence, the image of the shaded figure under the combined transformation EP is the figure B.

3.1d Describing the Combination of Two Transformations Given the Object and the Image


3.1d Describing the Combination of Two Transformations Given the Object and the Image
 
Example 1:

In the diagram above, triangle KLM is the image of triangle ABC under the combined transformations VW. Describe in full, the transformation and the transformation V.

Solution:


Figure ABC W→ Figure KB’C’ V → Figure KLM

W = Translation ( 0 4 )   
V= Enlargement with centre K(1, 1) and a scale factor of 3.


Example 2:


In the diagram above, triangle CKL is the image of triangle ABC under the combined transformations UY. Describe in full, the transformation and the transformation U.
 
Solution:


Figure ABC Y→ Figure AB’C U → Figure CKL
Y = Reflection in the straight line y = 6
= Enlargement with centre C(12, 6) and a scale factor of 2.


Example 3:


In the diagram above, triangle PQR is the image of triangle ABC under the combined transformations TW. Describe in full, the transformation and the transformation T.
 
Solution:


Figure ABC W→ Figure PBC’ T → Figure PQR
W = Clockwise rotation of 90o about the point (5, 5)
= Enlargement with centre (1, 5) and a scale factor of 2.

3.2 Solving Problems involving Transformations


3.2 Solving Problems involving Transformations

Example:
The diagram below shows the triangles ABCSQT and PQR.


(a) Transformation T is a translation (  5 2 )  
Transformation P is a reflection in the straight line y = 7.
State the coordinates of the image of point A under each of the following transformations:
(i) Transformation T,
(ii) Combined transformation PT.

(b)
(i) PQR is the image of triangle ABC under the combined transformations MN. Describe in full, the transformation N and the transformation M.
(ii) Given that the area of the shaded region PSTR is 200 m2, calculate the area of the triangle SQT.

Solution:
(a)


(i) A(3, 11) → TA’(8, 9).
(ii) A(3, 11) → TA’(8, 9) → A”(8, 5).


(b)(i)

N = Anticlockwise rotation of 90o about the point B(5, 10).


(b)(ii)


= Enlargement with centre (5, 12) and a scale factor of 3.


(c)
Area of image = (Scale factor)2 x Area of object
Area of PQR = 32 x Area of SQT
Area of SQT + Area of PSTR = 9 x Area of SQT
Area of SQT + 200 = 9 x Area of SQT
200 = 9 x Area of SQT – Area of SQT
200 = 8 x Area of SQT
Area of SQ= 200 8
Area of SQT = 25 m2

2.5 SPM Practice (Long Questions)


Question 6:
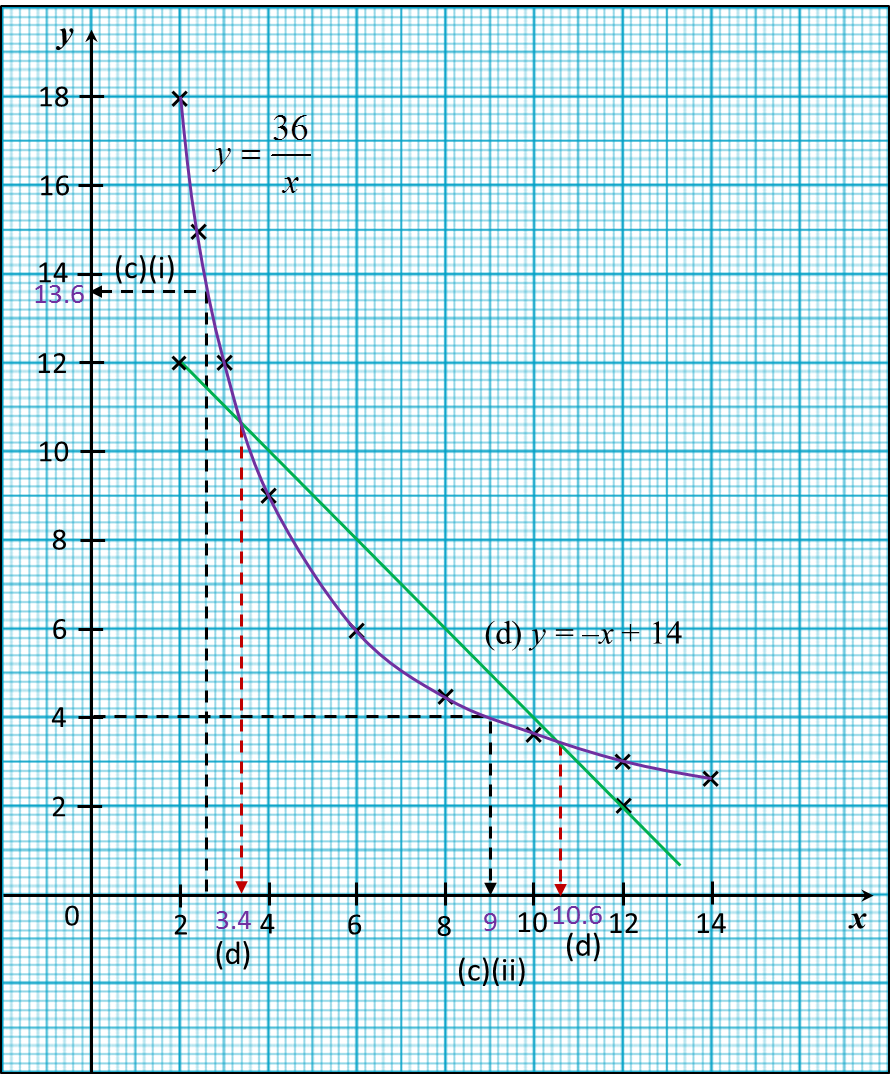
(a) Complete the table in the answer space for the equation y= 36 x   by writing down the values of y when x = 3 and x = 8.

(b) For this part of the question, use graph paper. You may use a flexible curve rule.
By using a scale of 1 cm to 1 unit on the x-axis and 1 cm to 1 unit on the y-axis, draw the graph of y= 36 x  for 2 ≤ x ≤ 14.

(c) From your graph, find
(i) the value of y when x = 2.6,
(ii) the value of x when y = 4.

(d) Draw a suitable straight line on your graph to find the values of x which satisfy the equation 36 x +x14=0  for 2 ≤ x ≤ 14.

Answer:
x
2
2.4
3
4
6
8
10
12
14
y
18
15
9
6
3.6
3
2.6

Solution:
(a)
y= 36 x when x=3 y= 36 3 =12 when x=8 y= 36 8 =4.5

(b)


(c)
(i) From the graph, when x = 2.6, y = 13.6
(ii) From the graph, when y = 4, x = 9

(d)
y= 36 x  ........... ( 1 ) 0= 36 x +x14 ........... ( 2 ) ( 1 )( 2 ): y=x+14

The suitable straight line is y = x + 14.

x
2
12
y = x + 14
12
2
From the graph, x = 3.4, 10.6.

2.2 Solving Equations Graphically


2.2 Solving equations graphically
 
The solution of the equation f (x) = g (x) can be solved by graphical method.

Step 1
: Draw the graphs of y = f (x) and y = g (x) on the same axes.
Step 2: The points of intersection of the graphs are the solutions of the equation f (x) = g(x). Read the values of x from the graph. 


Solution of an Equation by Graphical Method

Example 1:
(a) The following table shows the corresponding values of x and y for the equation = 2x2 x – 3.
 
x
–2
–1
–0.5
1
2
3
4
4.5
5
y
7
m
– 2
–2
3
12
n
33
42
Calculate the value of m and n.
 
(b) For this part of the question, use graph paper. You may use a flexible curve rule.
By using a scale of 2 cm to 1 unit on the x-axis and 2 cm to 5 units on the y-axis, draw the graph of  y = 2x2 x – 3 for –2 ≤ x ≤ 5.

(c)
From your graph, find
(iThe value of when x = 3.9,
(iiThe value of when y = 31.
 
(d) Draw a suitable straight line on your graph to find the values of x which satisfy the equation 2x 3x = 10 for –2 ≤ x ≤ 5.

Solution:
(a)
= 2x2 x – 3
when x = –1,
= 2 (–1)2 – (–1) – 3 = 0
when x = 4,
= 2 (4)2 – (4) – 3 = 25

(b)


(c)
(i) From the graph, when x = 3.9, y = 23.5
(iiFrom the graph, when y = 31, x = 4.4

(d)
= 2x2 x – 3 ----- (1)
2x 3x = 10 ----- (2)
= 2x2 x – 3 ----- (1)
0 = 2x2 3x – 10 ------ (2) ← (Rearrange (2))
(1)  – (2) : y = 2x + 7
The suitable straight line is y = 2x + 7.
 
Determine the x-coordinates of the two points of intersection of the curve 
y = 2x2 x – 3 and the straight line y = 2x+ 7.
 
x
0
4
y = 2x + 7
7
15
From the graph, = –1.6, 3.1


2.4 SPM Practice (Short Questions)


2.4.2 SPM Practice (Short Questions)
 
Question 3:
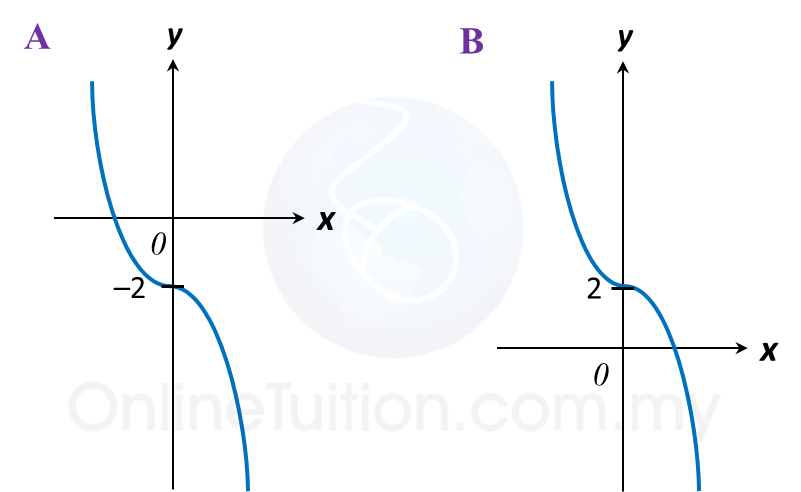
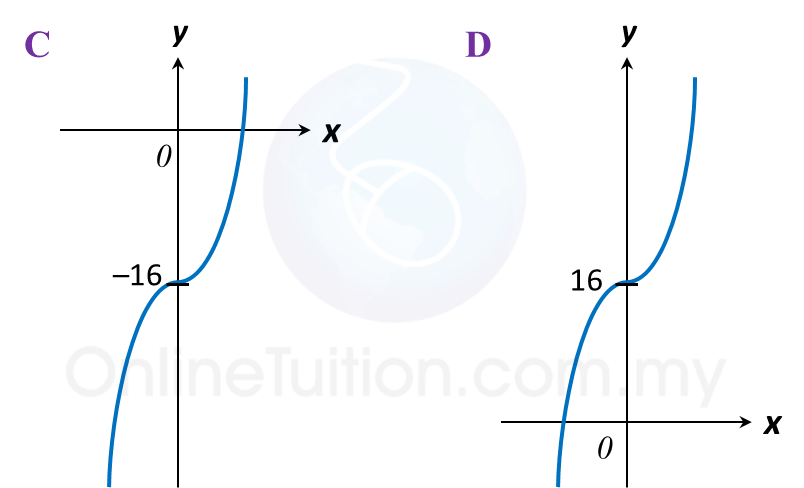
Which of the following graphs represent y = 2x– 16?


Solution:
y = 2x3 – 16
On the y-axis, x = 0.
y = 2(0)3 – 16
y = –16
 
The answer is C.


Question 4:
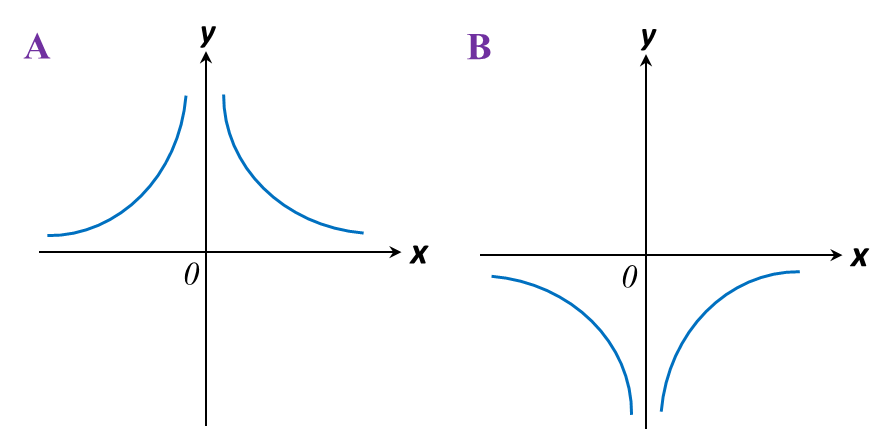
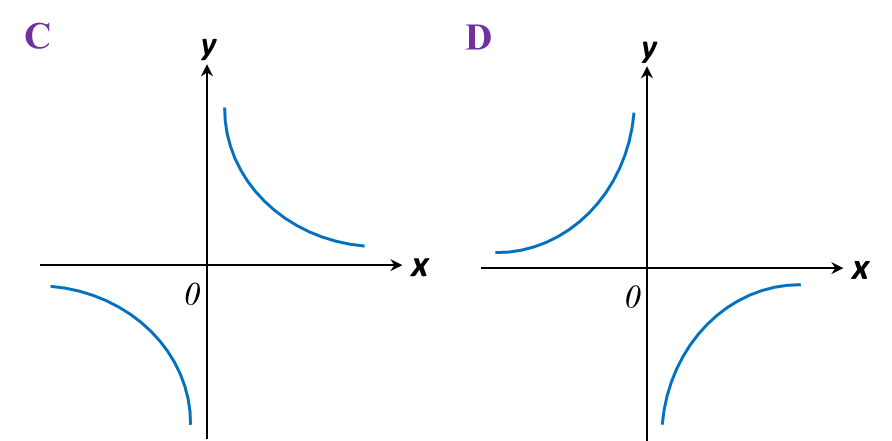
Which of the following graphs represent y = 3 x ?


Solution:
y= 3 x  or y=3 x 1
Highest power of the variable x is –1.
It is a reciprocal function y= a x , in this case a=3.
The answer is D.

2.5 SPM Practice (Long Questions)


Question 5:
(a) The following table shows the corresponding values of x and y for the equation y = 24 x
  
x
–4
–3
–2
–1
1
1.5
2
3
4
y
–6
k
–12
–24
24
n
12
8
6
Calculate the value of k and n.
 
(b) For this part of the question, use graph paper. You may use a flexible curve rule.
By using a scale of 2 cm to 1 unit on the x-axis and 2 cm to 5 units on the y-axis, draw the graph of  y = 24 x  for –4 ≤ x ≤ 4.
 
(c) From your graph, find
(i) The value of when x = 3.5,
(ii) The value of when y = –17.
 
(d) Draw a suitable straight line on your graph to find the value of x which satisfy the equation 2x2 + 5= 24 for –4 ≤ x ≤ 4.
 
Solution:
(a)
y= 24 x when x=3, k= 24 3 =8 when x=1.5, n= 24 1.5 =16

(b)


(c)
(i) From the graph, when x = 3.5, y = 7
(ii) From the graph, when y = –17, x = –1.4

(d)
 

y = 24 x -------------- (1) 2 x 2 + 5 x = 24 ------ (2) ( 2 ) ÷ x , 2 x + 5 = 24 x -------- (3) ( 1 ) ( 3 ) , y ( 2 x + 5 ) = 0 y = 2 x + 5

The suitable straight line is y = 2x + 5.
Determine the x-coordinate of the point of intersection of the curve and the straight line = 2x + 5.
 
x
0
3
y = 2x + 5
5
11
From the graph, = 2.5

2.4 SPM Practice (Short Questions)


2.4 SPM Practice (Short Questions)
 
Question 1:
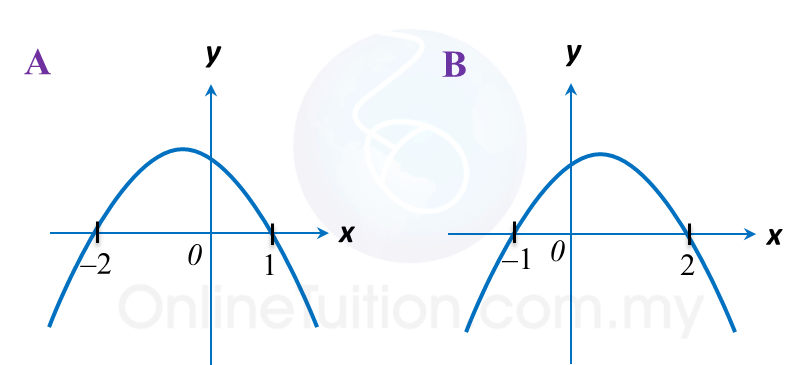
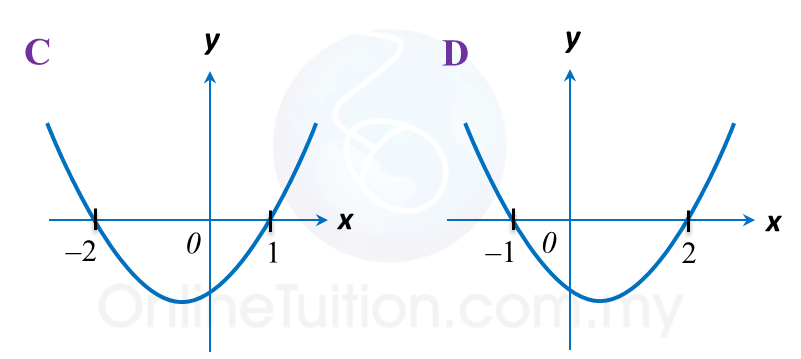
Which of the following graphs represent y = –x– x + 2?


Solution:
1.   The coefficient of x2 < 0, its shape is ∩.
2.   Find the x-intercepts by substituting y = 0 into the function.
y = –x2x + 2
when y = 0
0 = (–x + 1) (x + 2)
x = 1, –2
 
The answer is A.


Question 2:
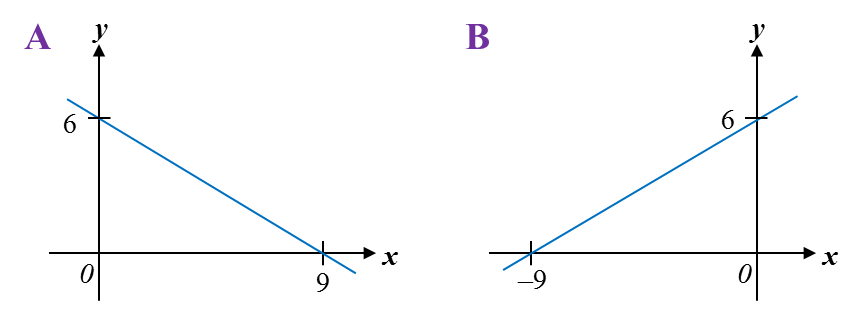
Which of the following graphs represent 3y = 18 + 2x?


Solution:
1.   The highest power of x = 1, it is a linear graph, i.e. a straight line.
2.   The coefficient of x > 0, the straight line is /.
 
3y = 18 + 2x
On the y-axis, x = 0.
3y = 18
y = 6
 
On the x-axis, y = 0.
0 = 18 + 2x
2x = –18
x = –9
 
The answer is B.
 

2.1 Graphs of Functions (Part 1)


2.1 Graphs of Functions
 
(A) Drawing graphs of functions
 
1. To draw the graph of a given function, the following steps are taken.

Step 1
: Construct a table of values for the given function.
Step 2: Select a suitable scale for the x-axis and y-axis, if it is not given.
Step 3: Plot the points and complete the graph by joining the points.
Step 4: Label the graph.