Question 11 (3 marks):
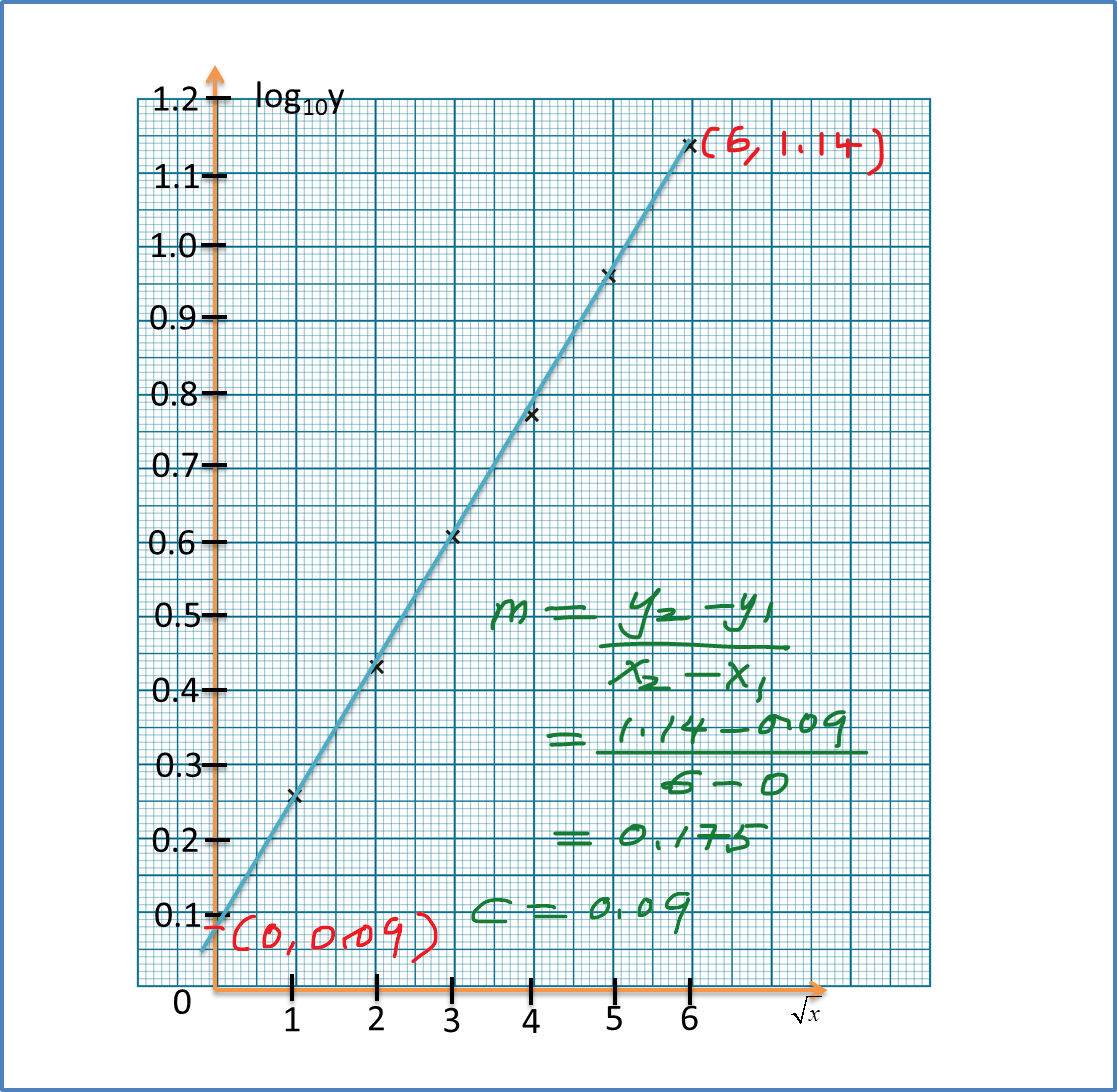
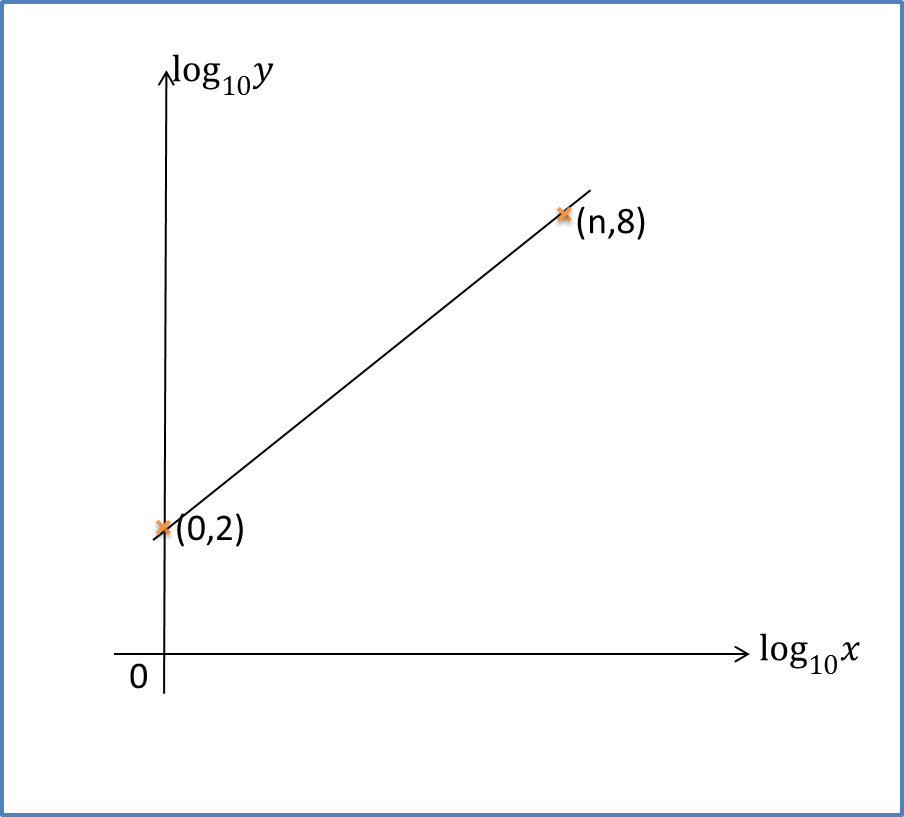
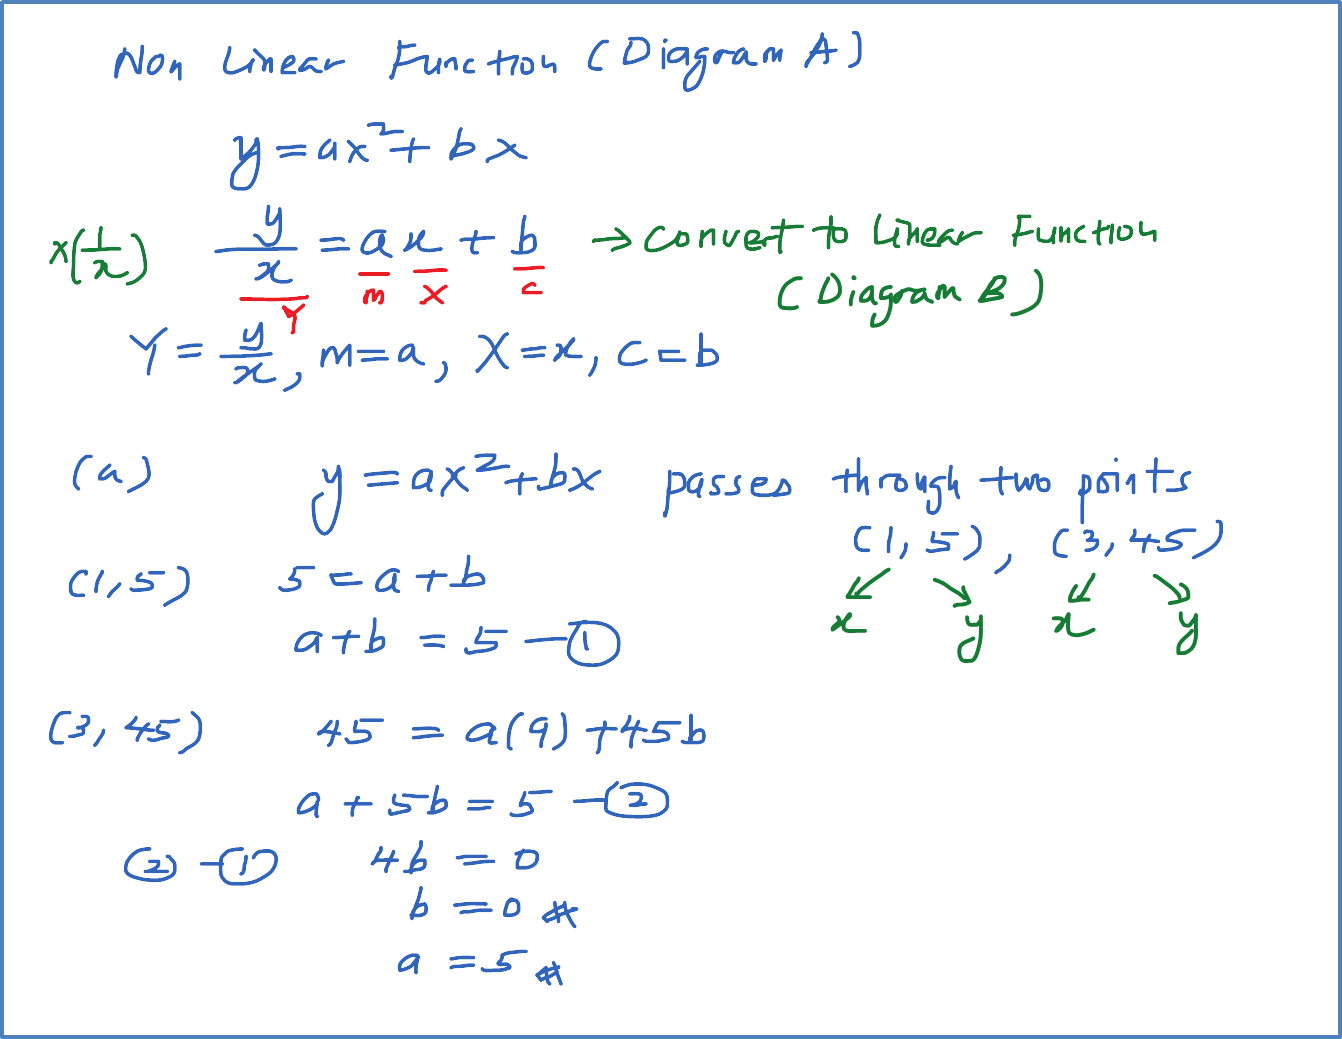
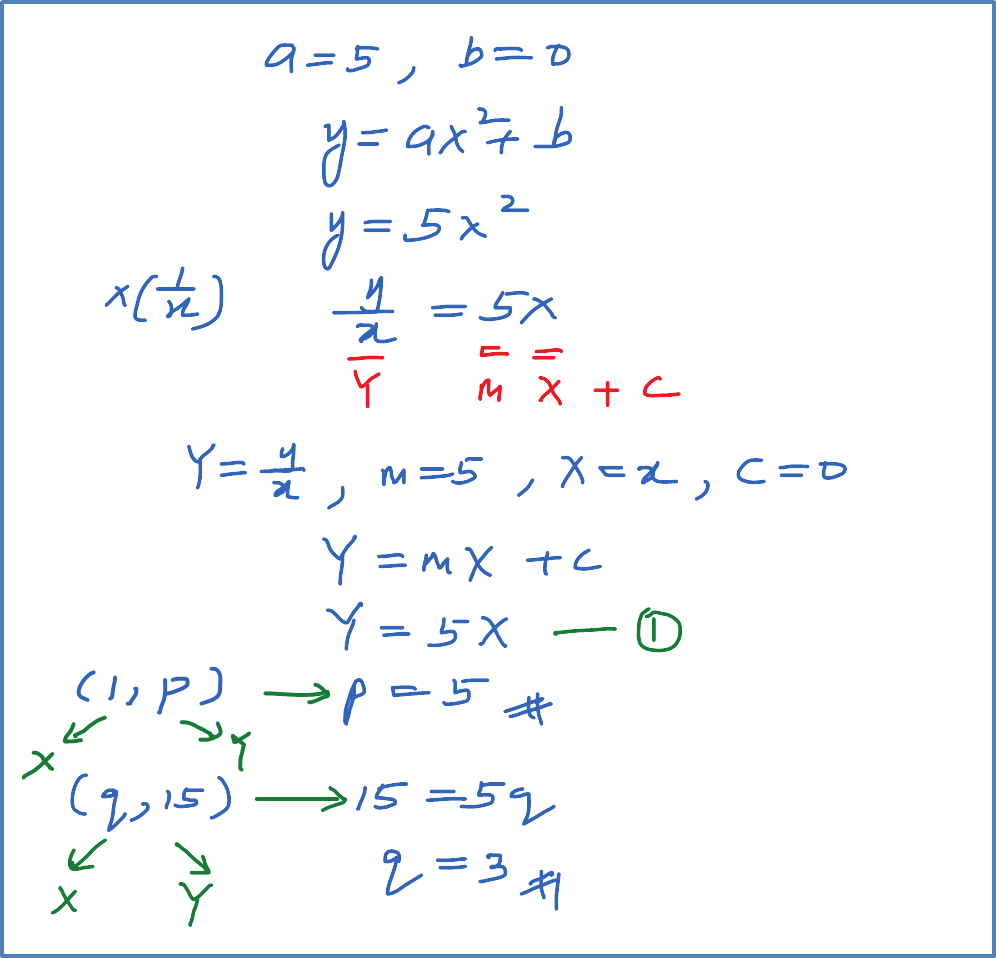
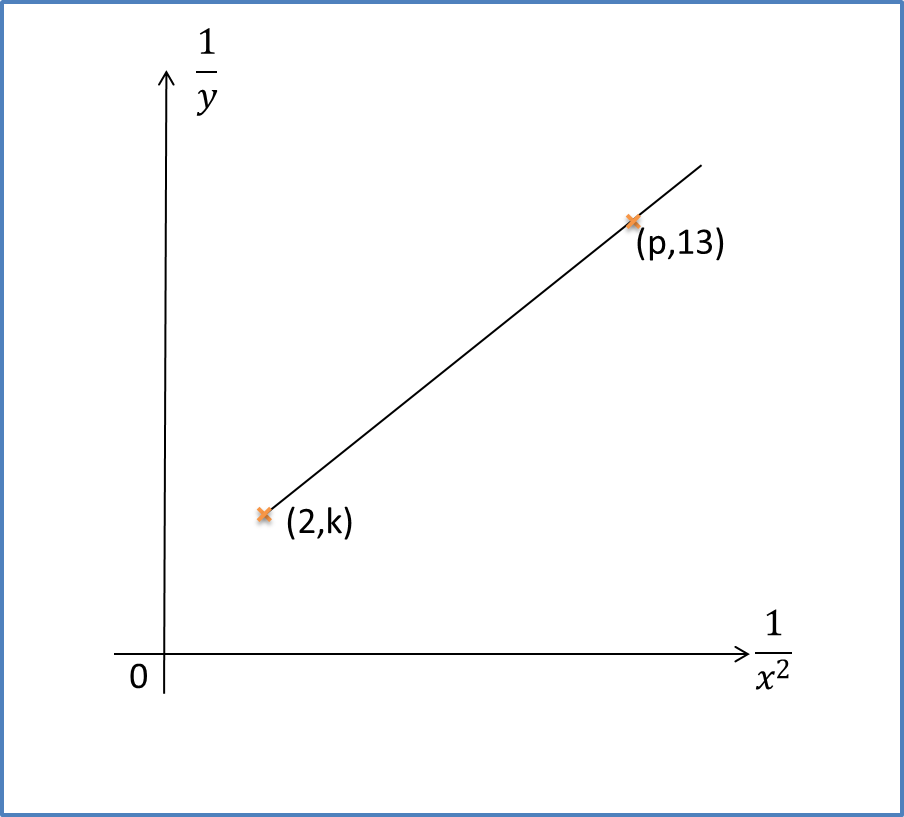
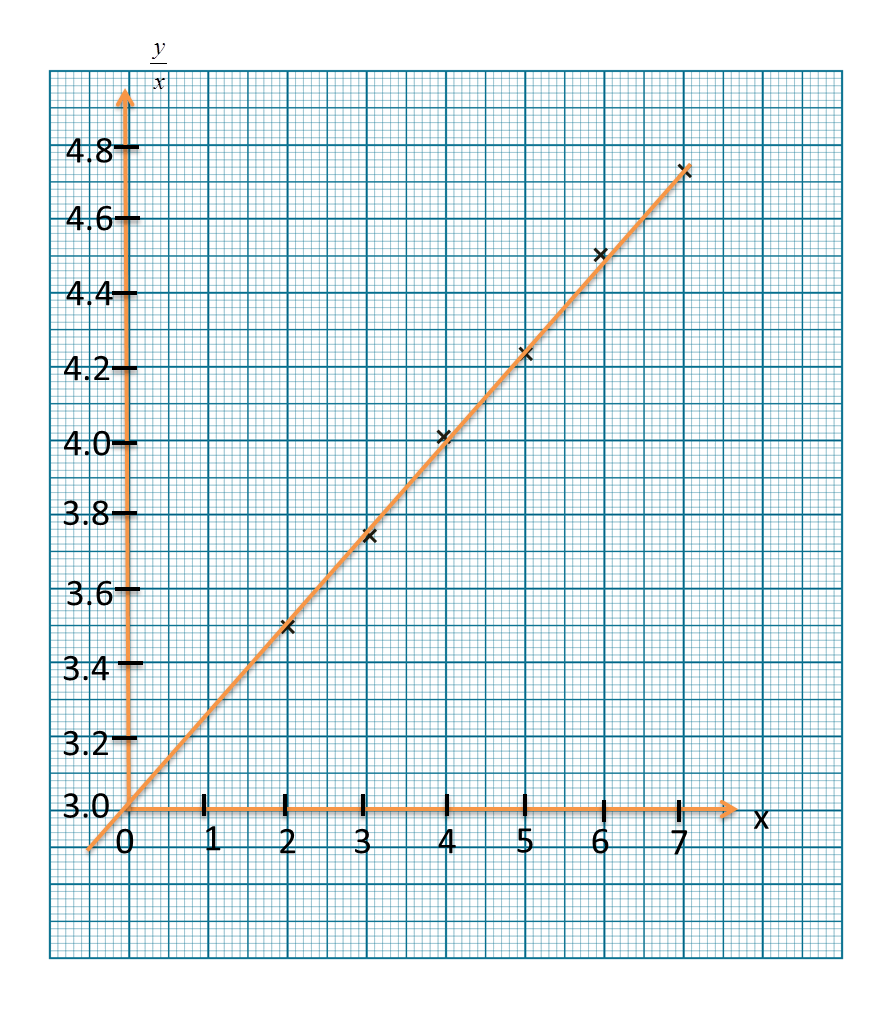
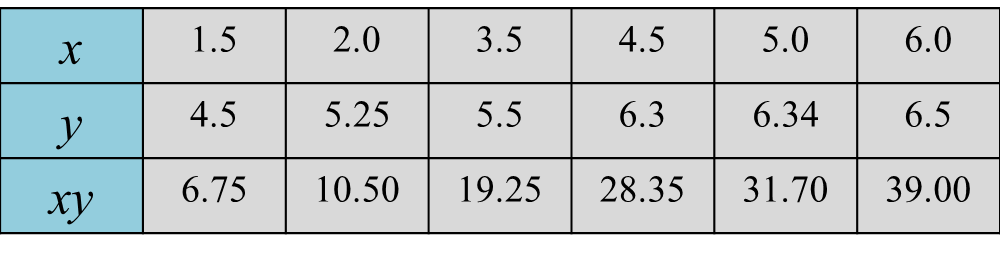
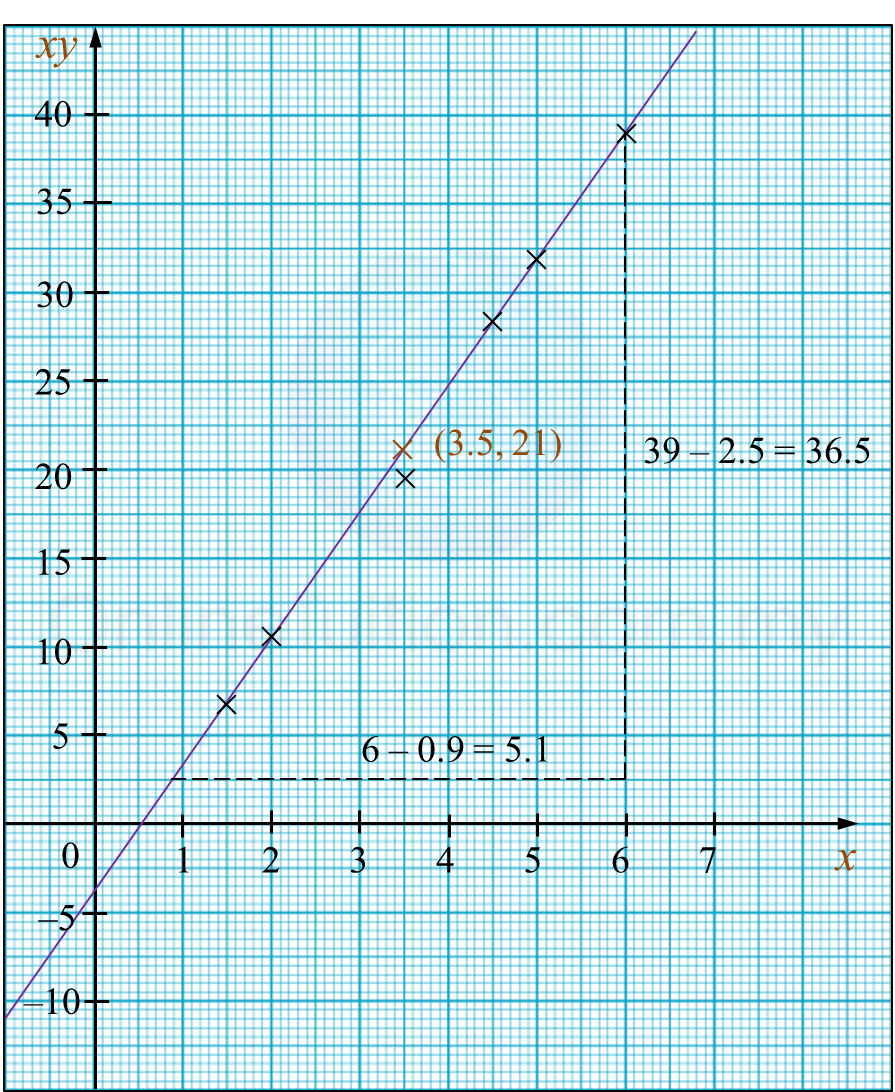
Diagram 6 shows the graph of a straight line
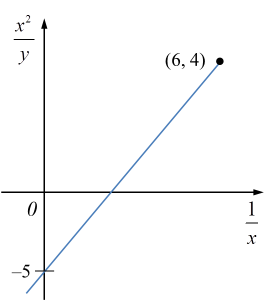 Diagram 11
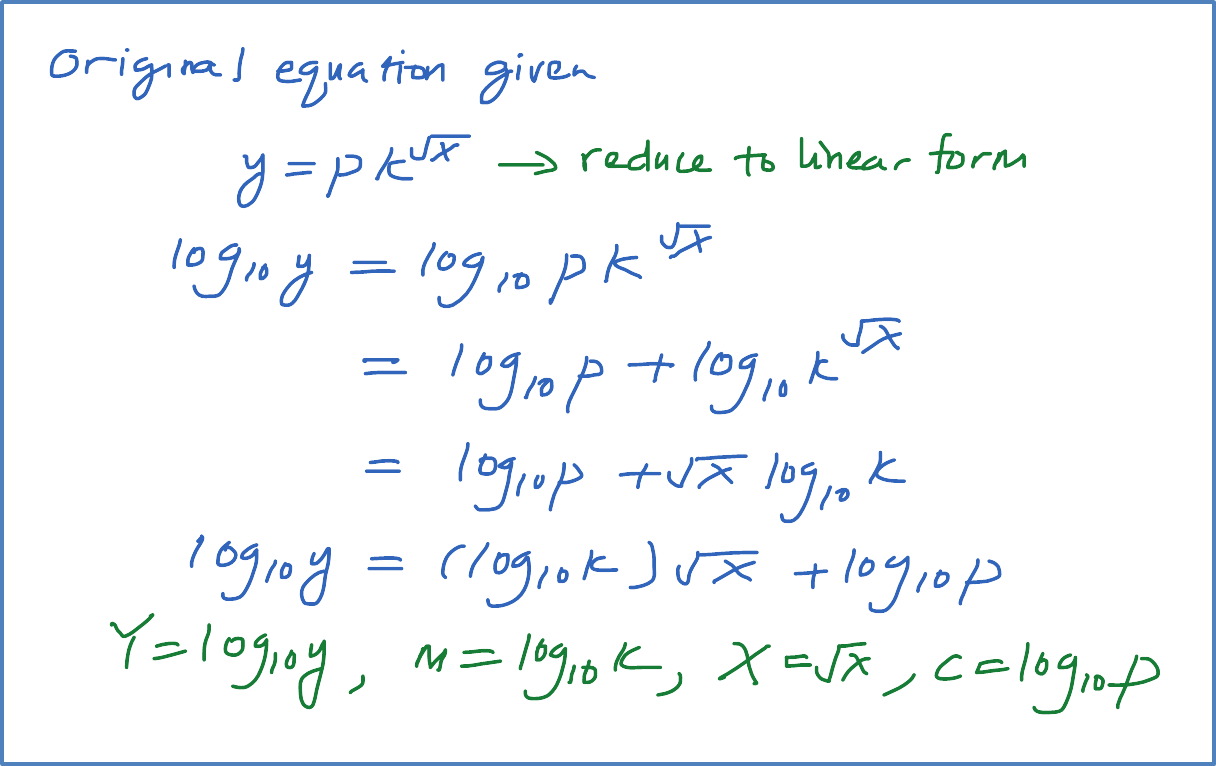
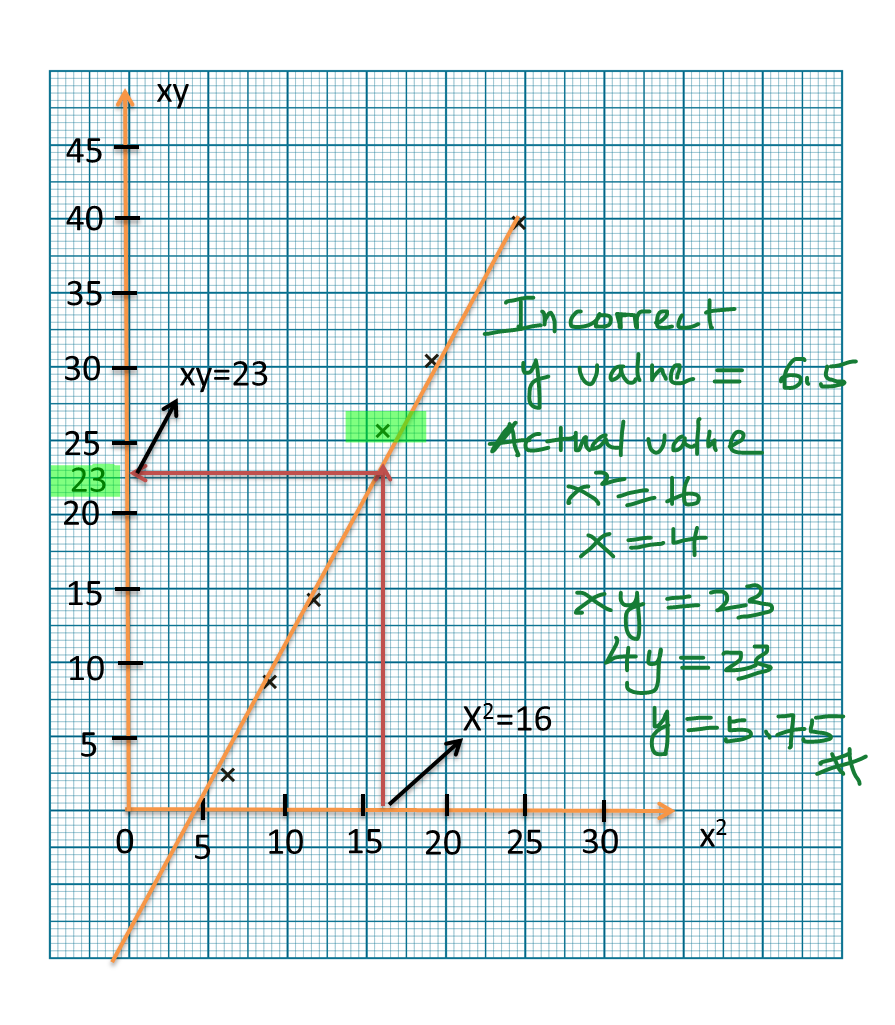
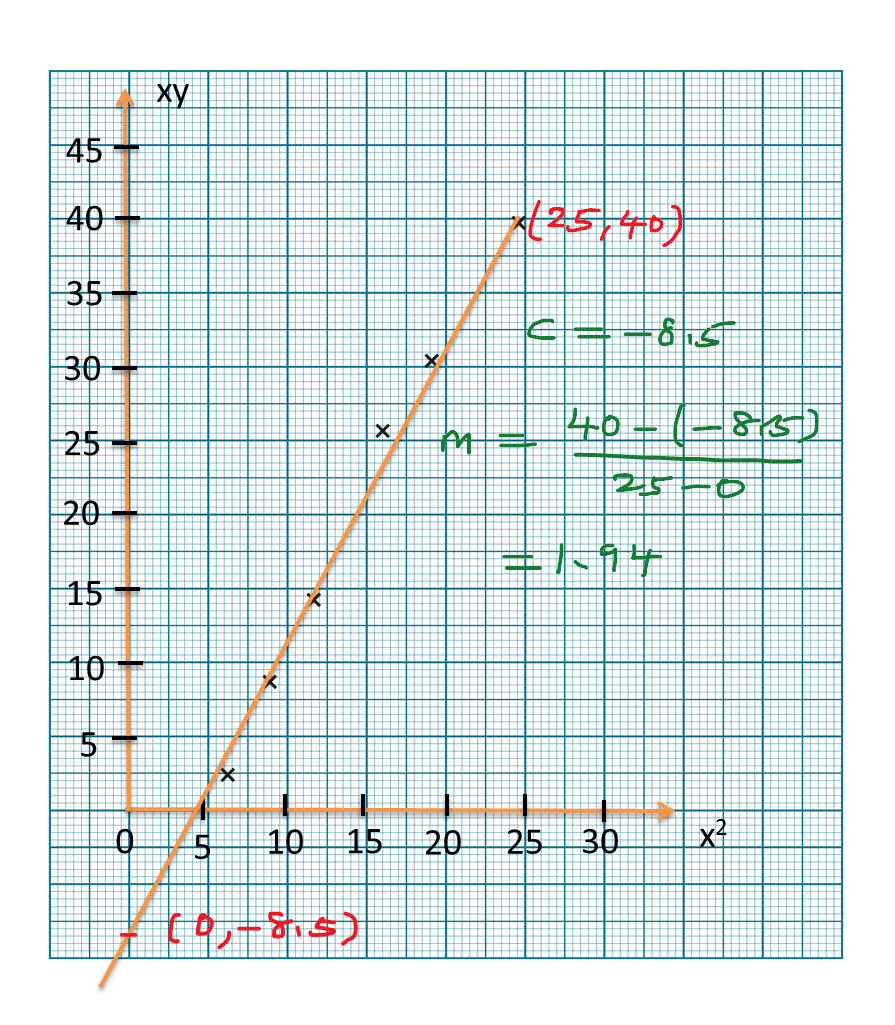
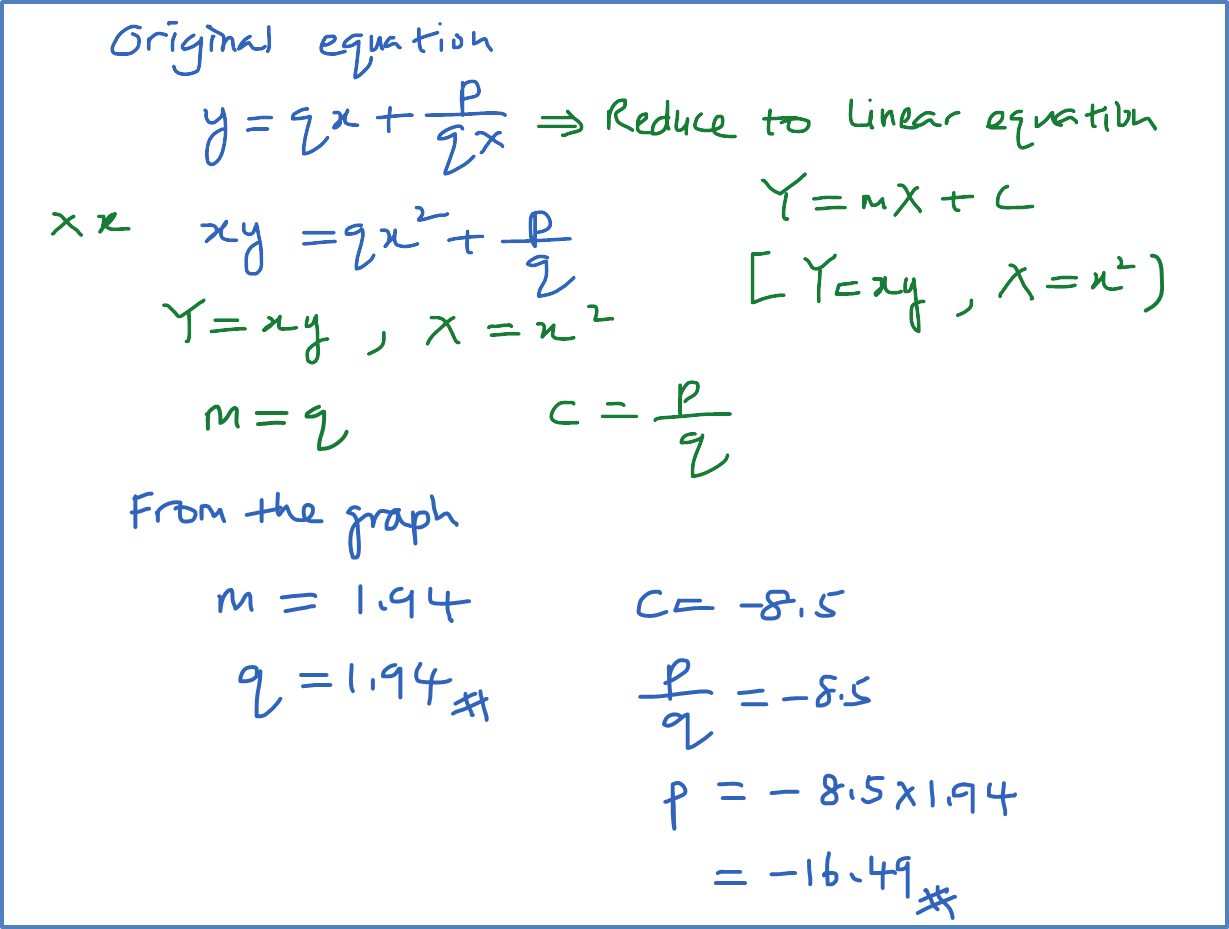
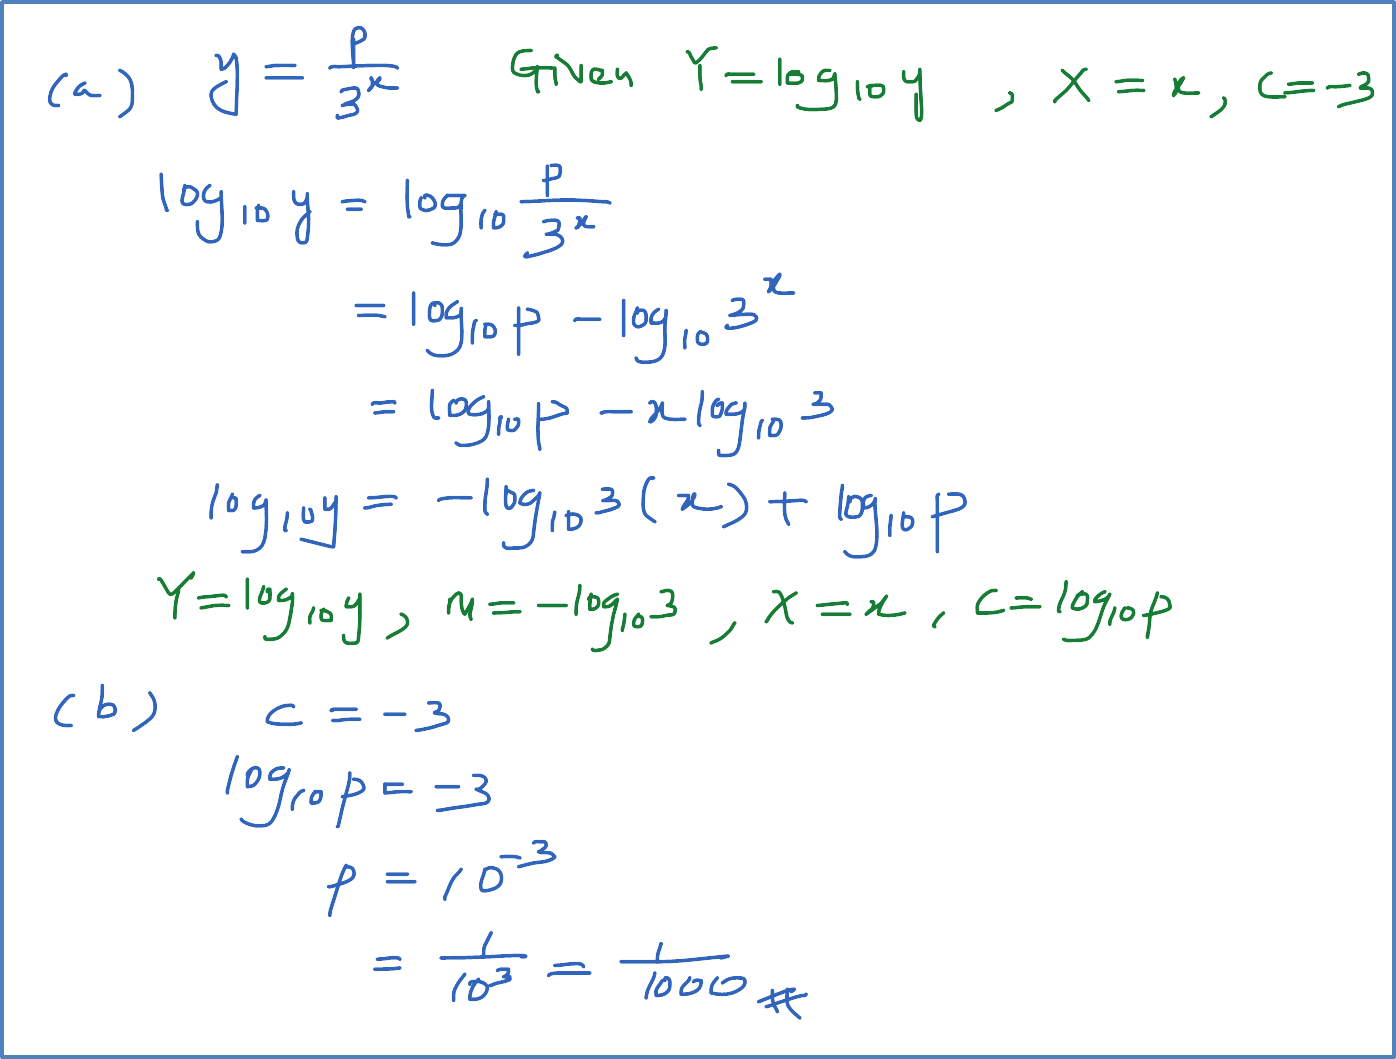
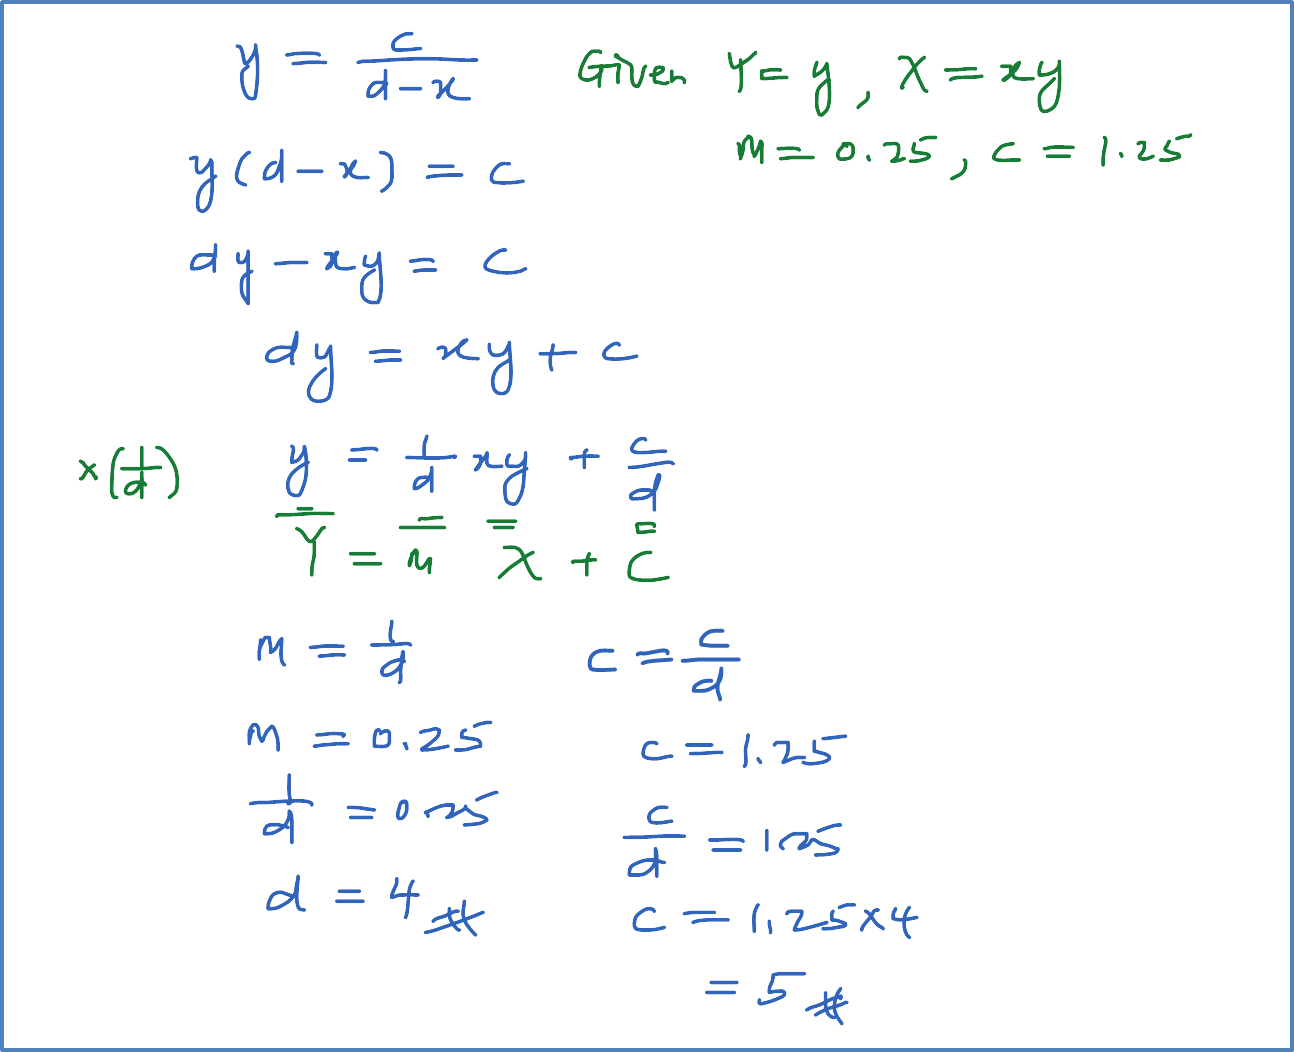
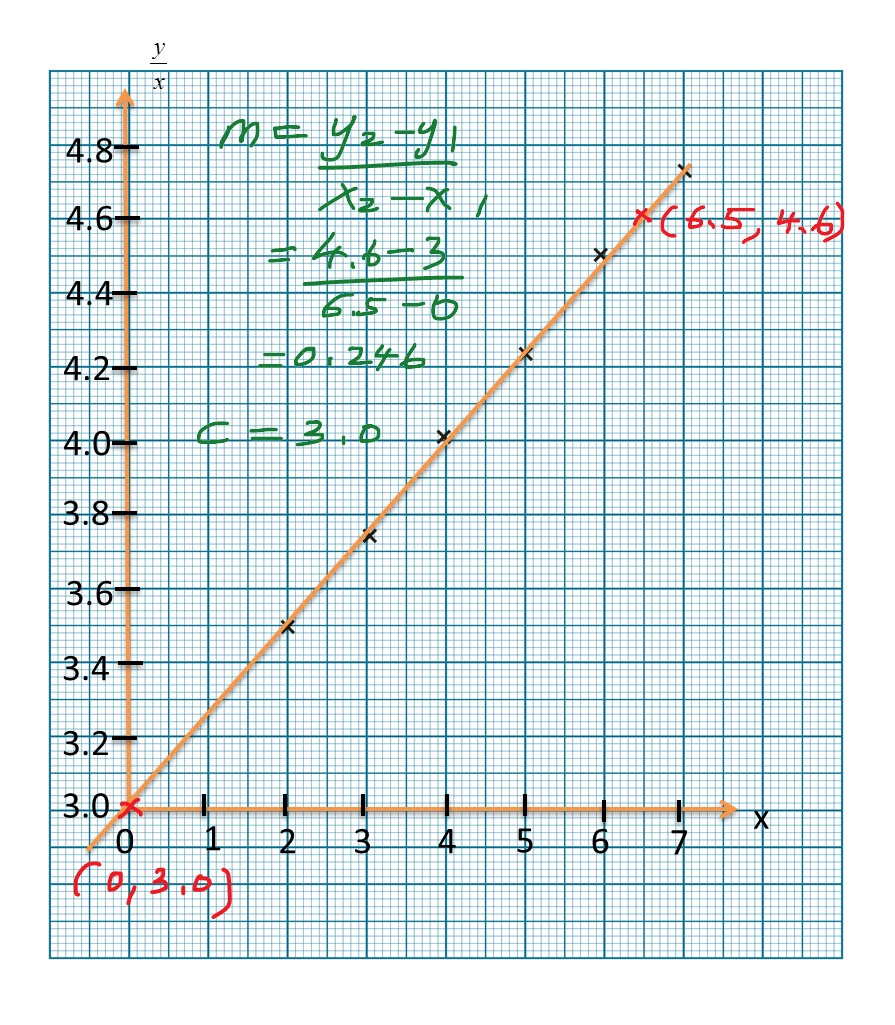
Based on Diagram 6, express y in terms of x.
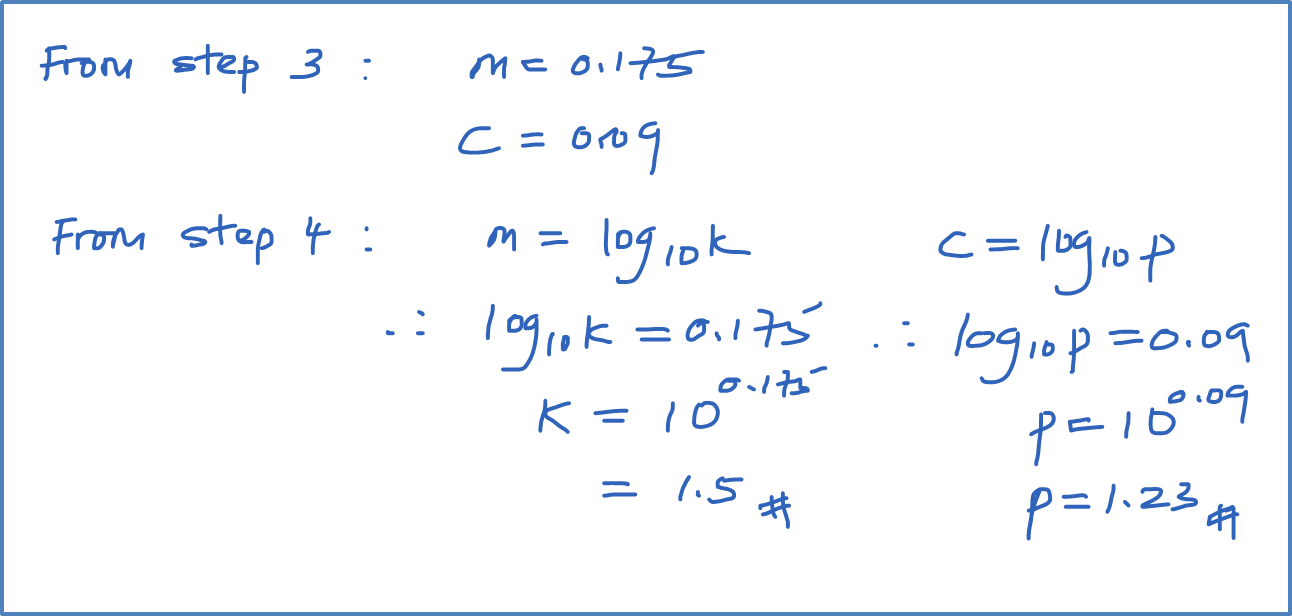
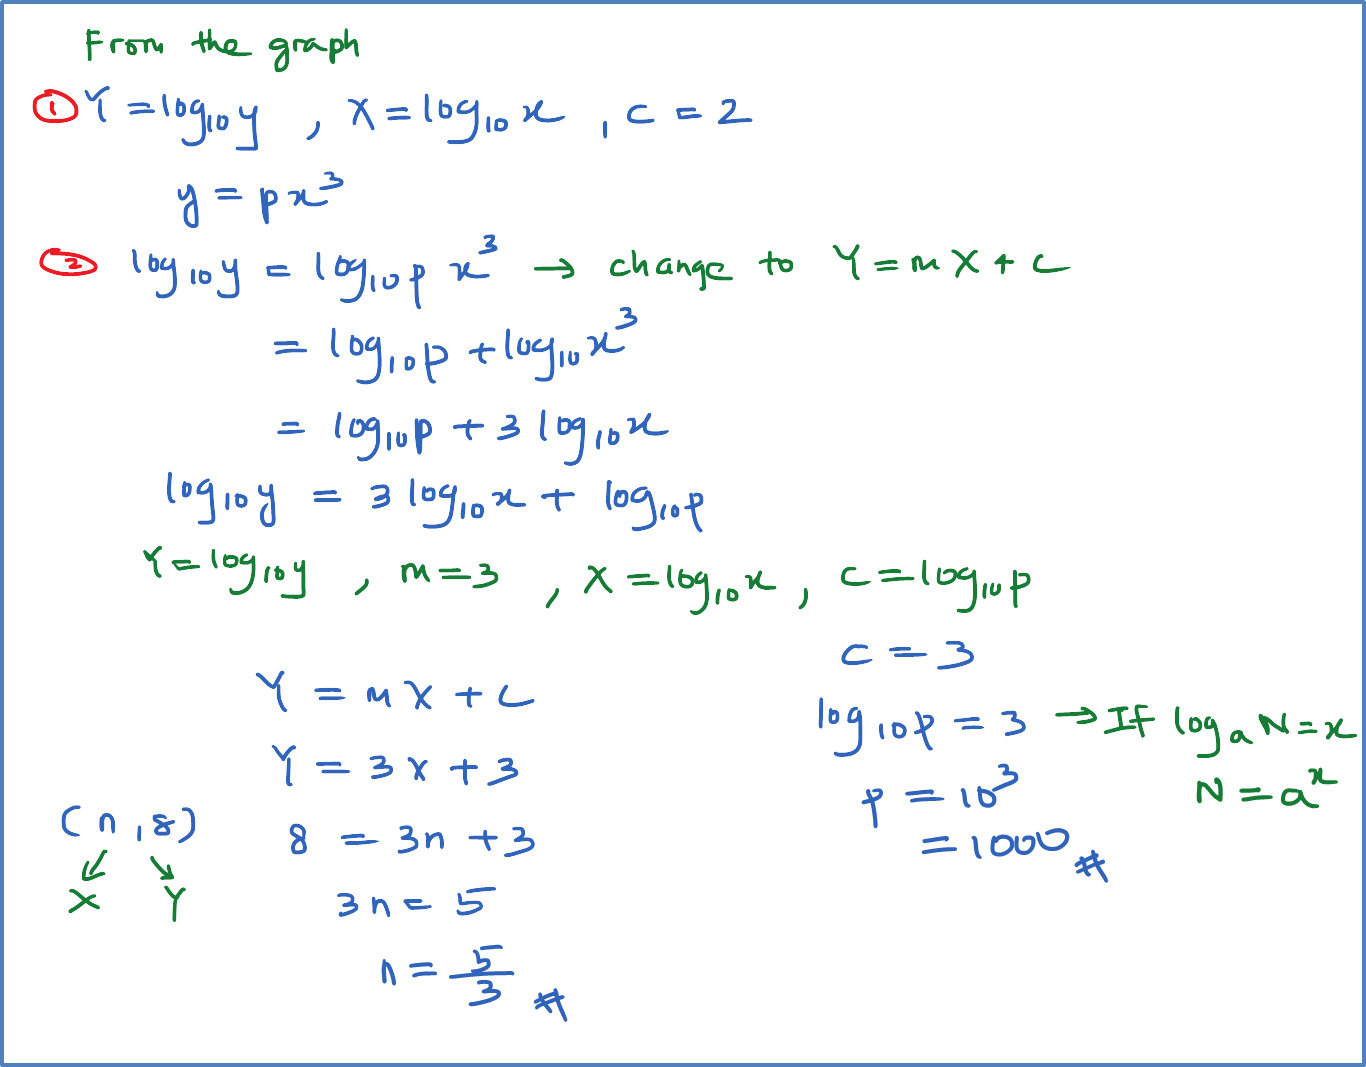
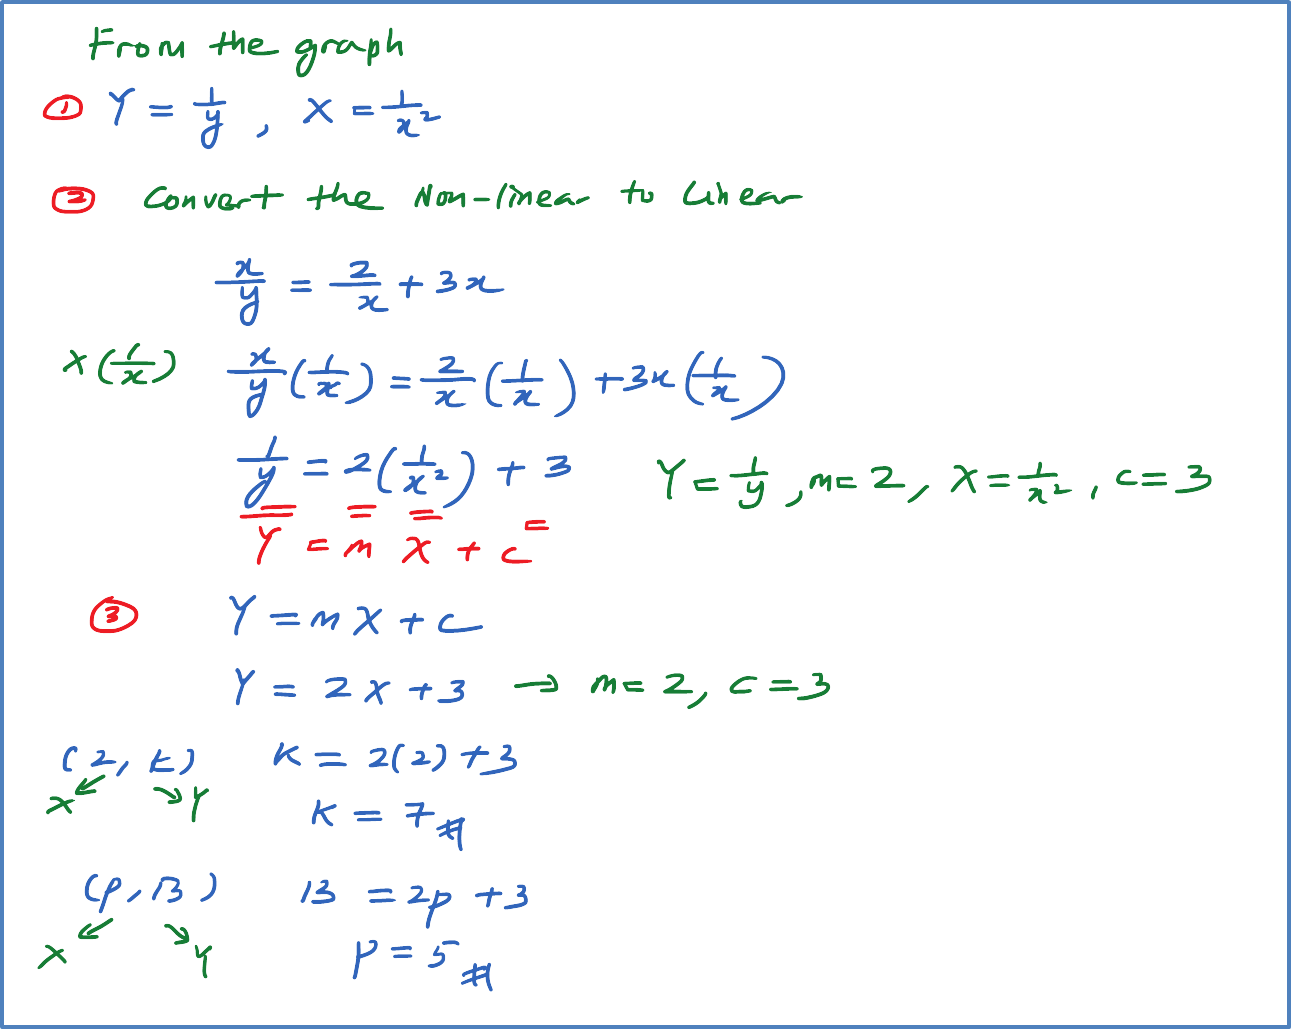
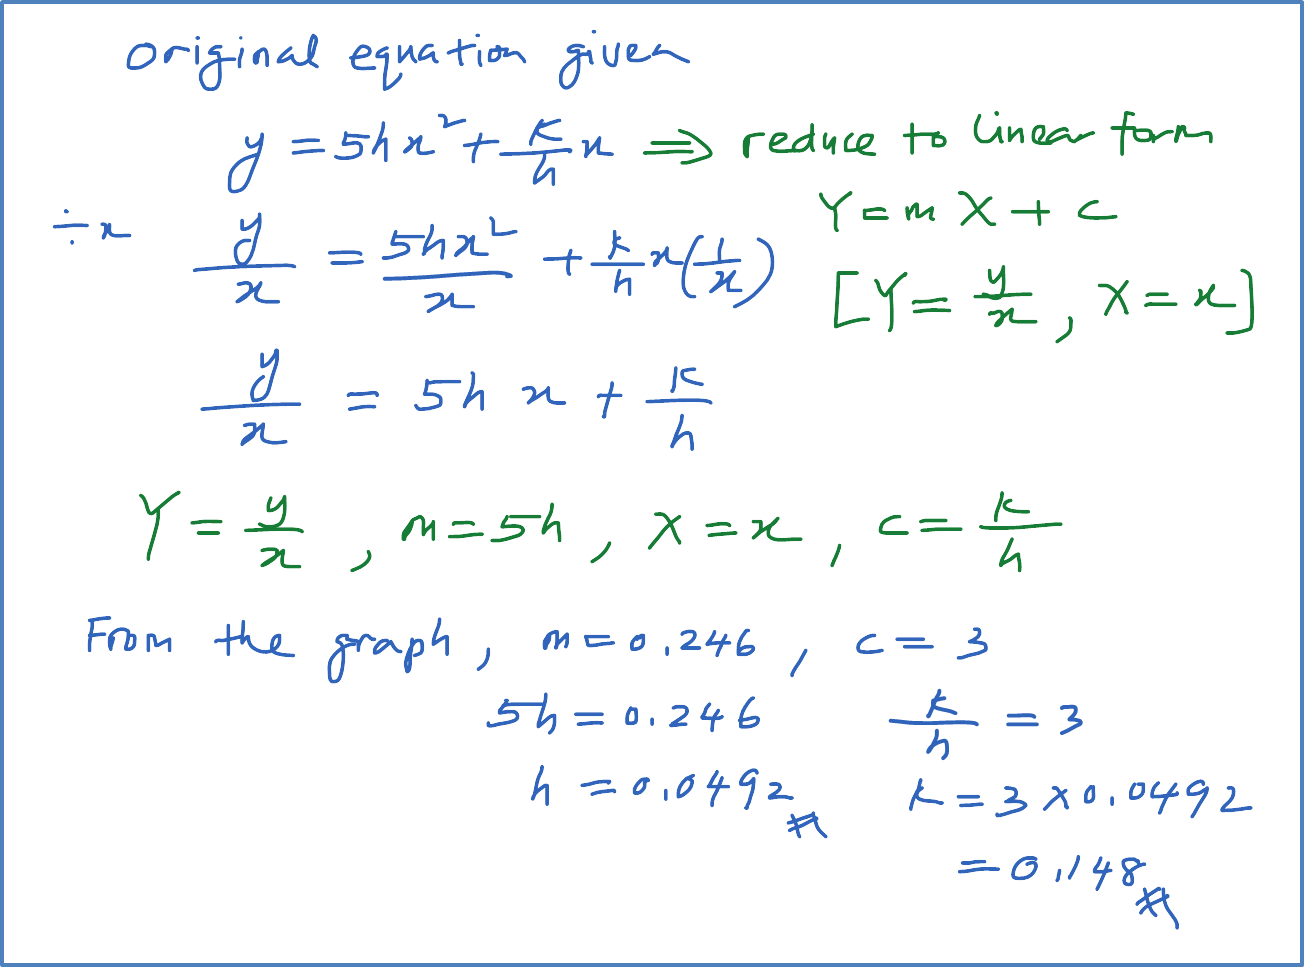
Solution:
Diagram 6 shows the graph of a straight line
Diagram 11Based on Diagram 6, express y in terms of x.
Solution:
Question 12 (3 marks):
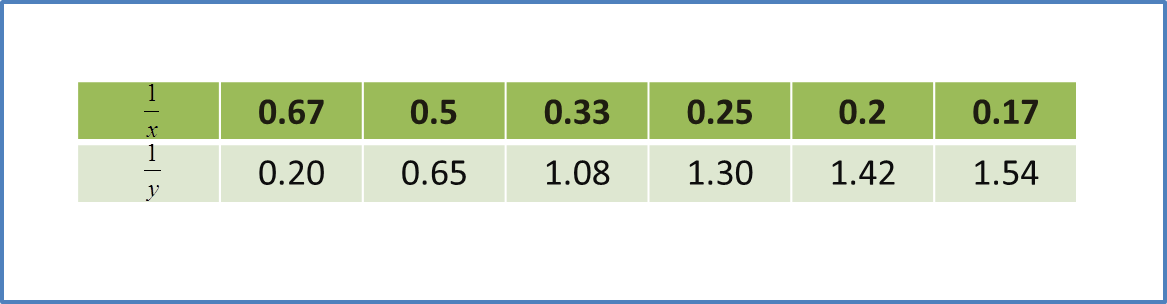
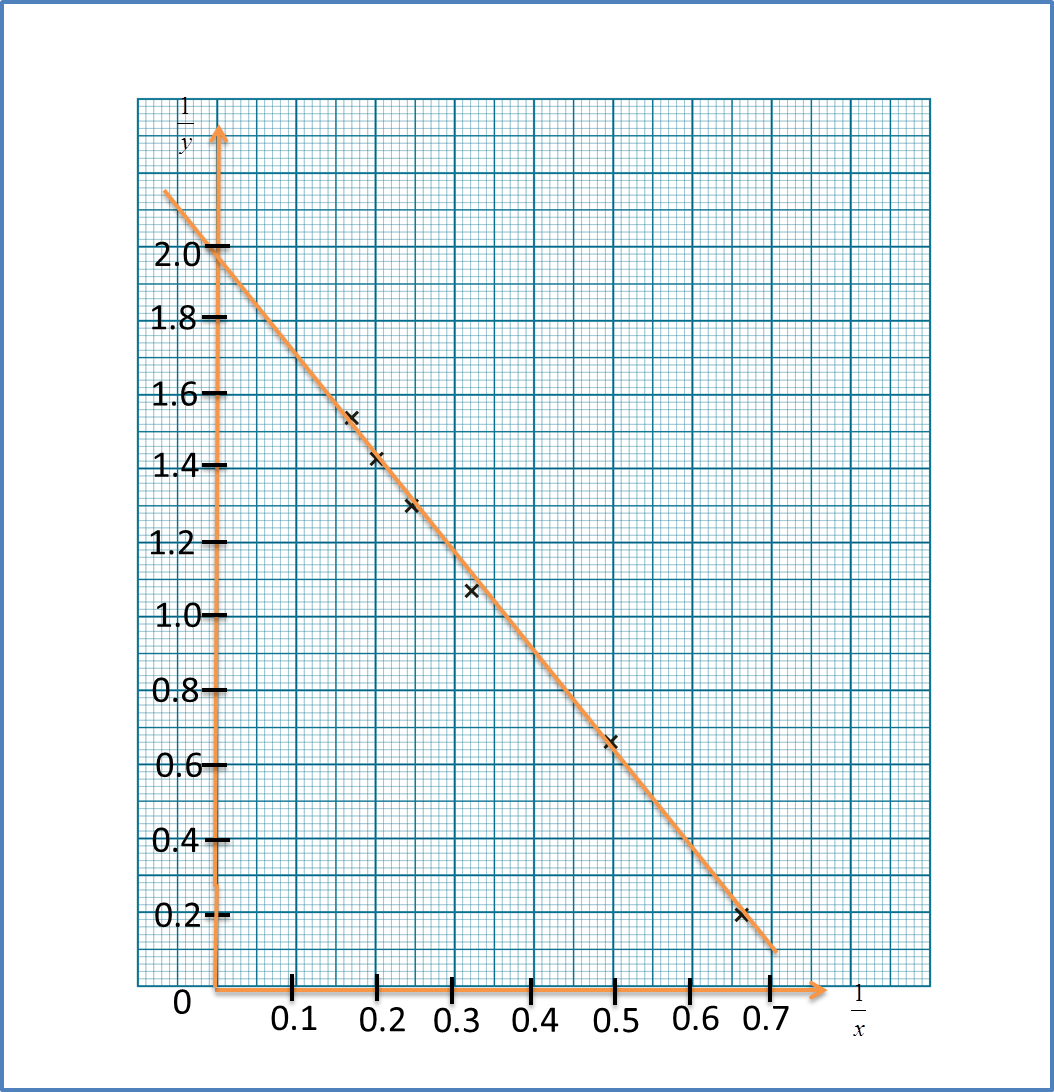
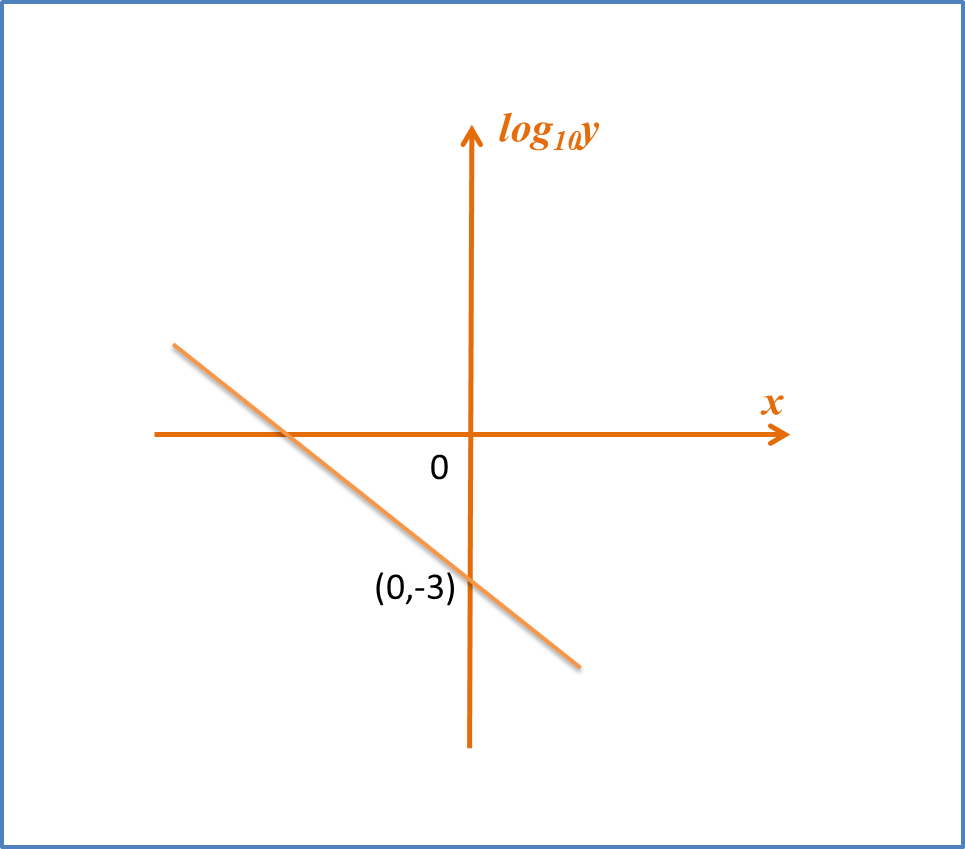
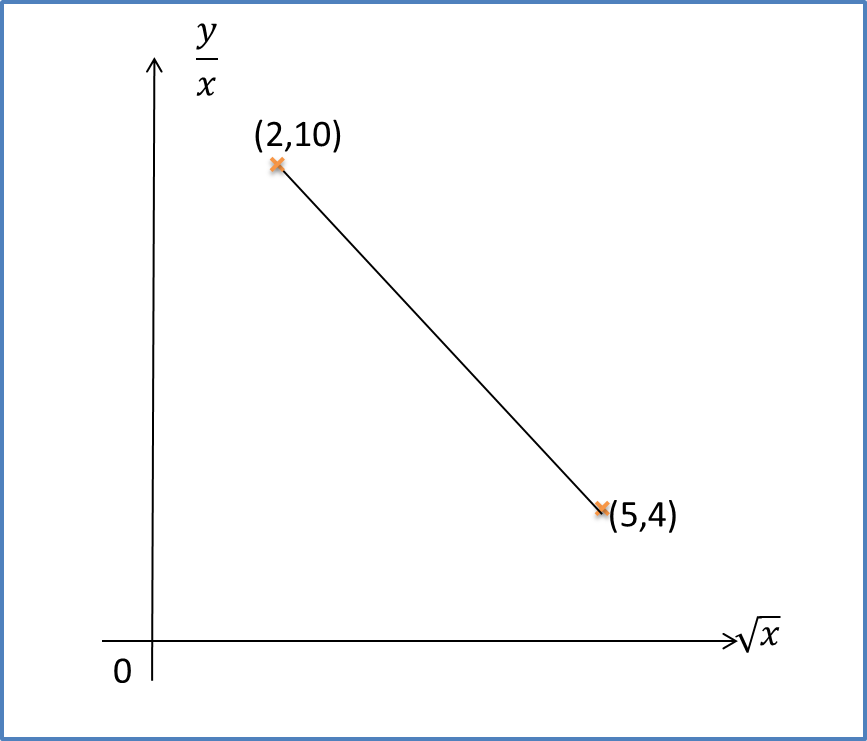
The variables x and y are related by the equation , where r is a constant. Diagram 8 shows a straight line graph obtained by plotting
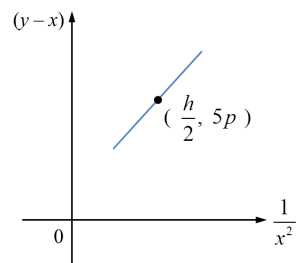 Diagram 12
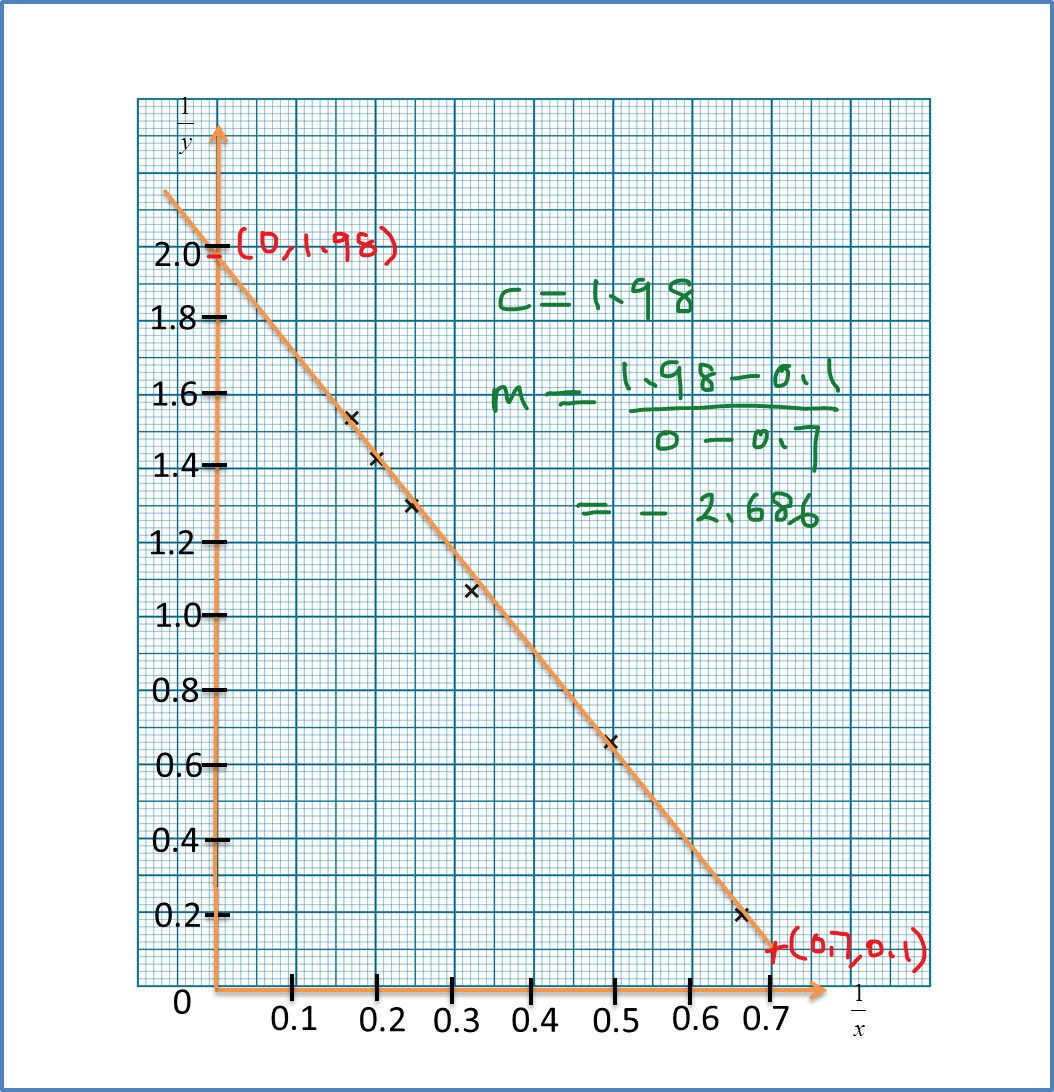
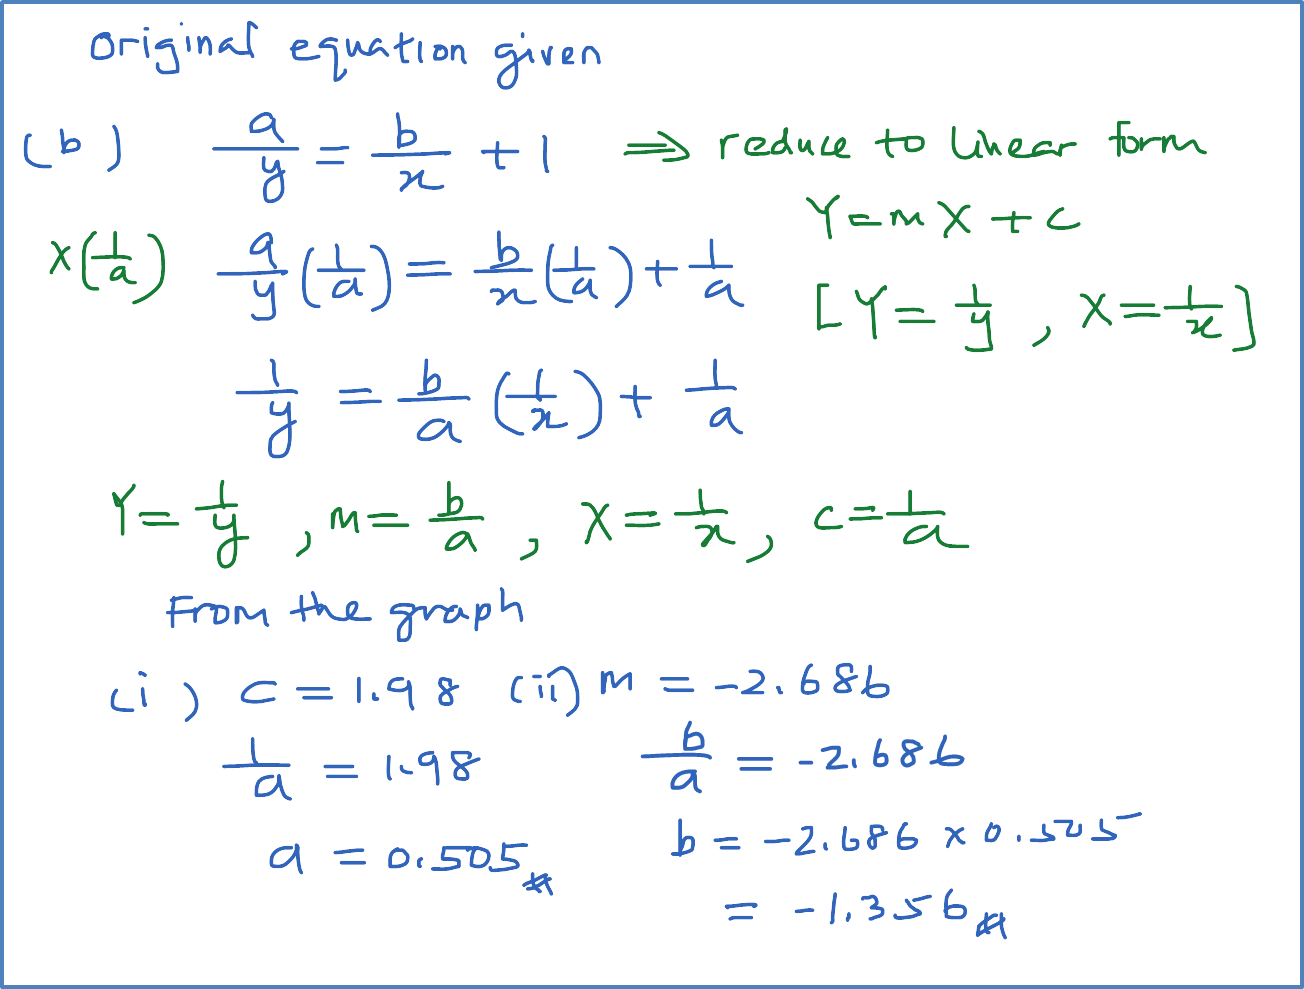
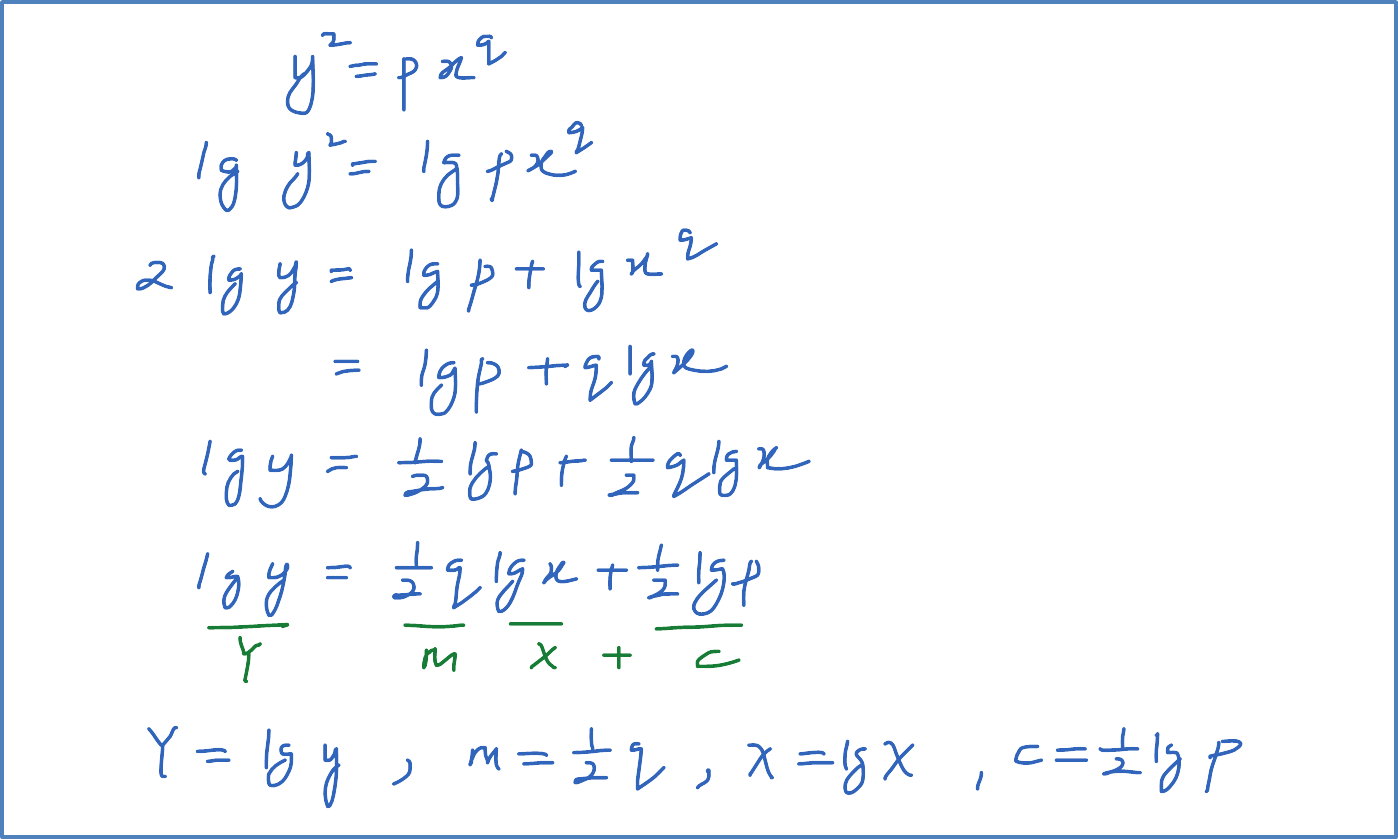
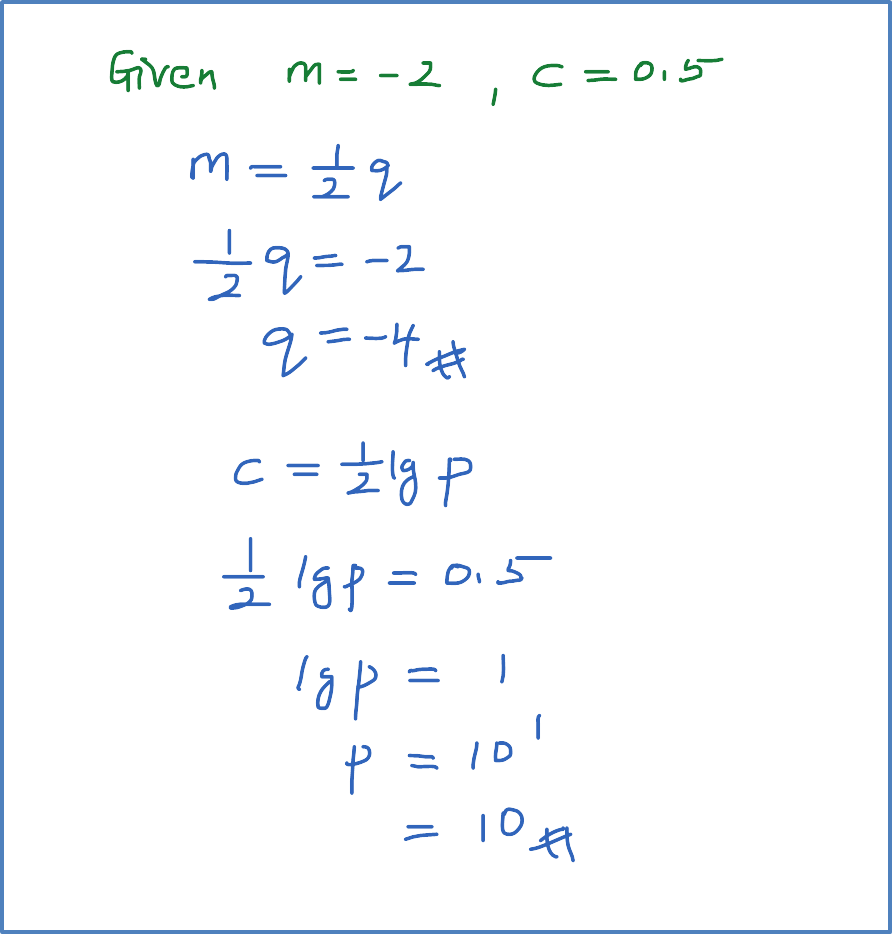
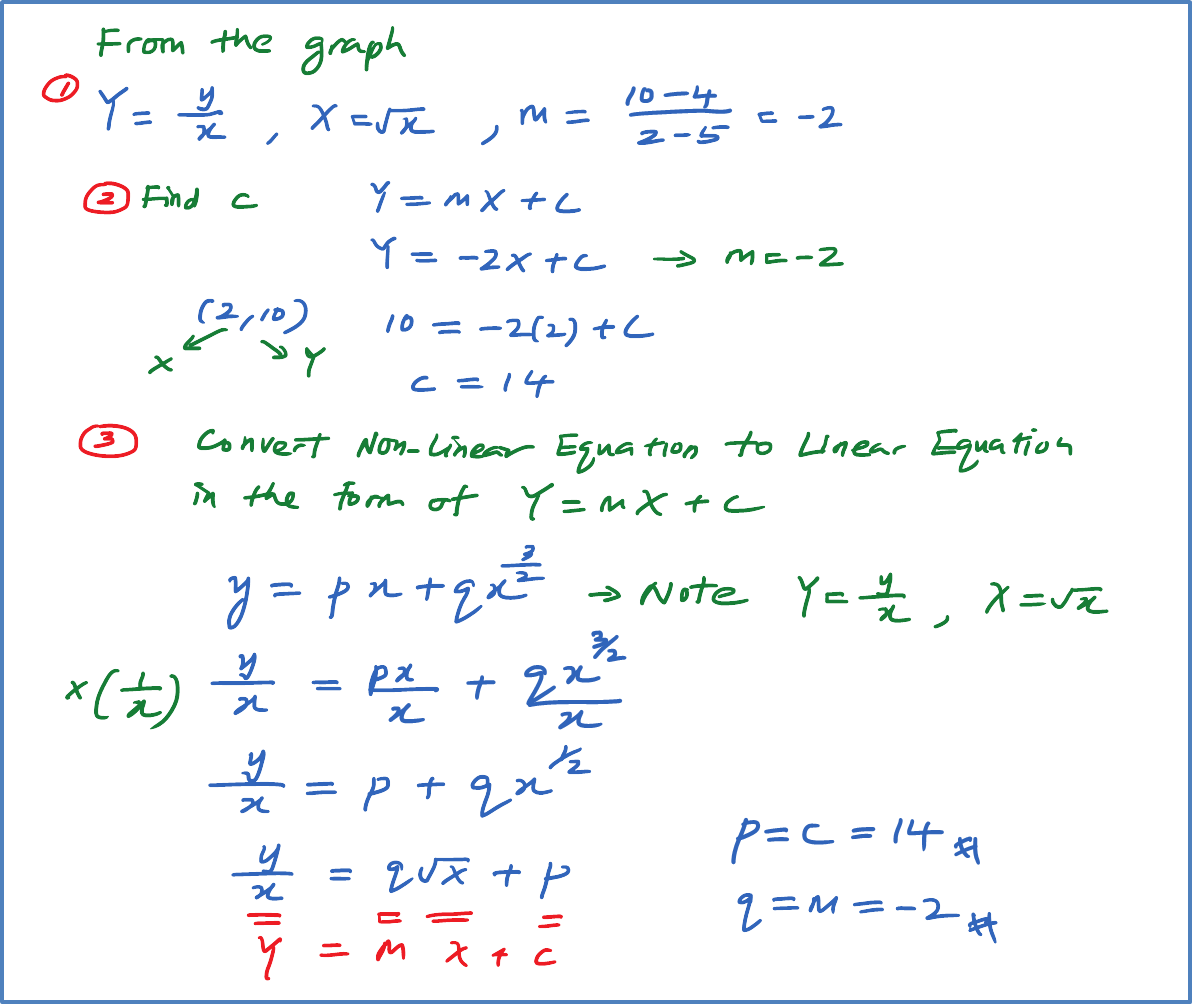
Express h in terms of p and r.
Solution:
The variables x and y are related by the equation , where r is a constant. Diagram 8 shows a straight line graph obtained by plotting
Diagram 12Express h in terms of p and r.
Solution: