2.2 Solving equations graphically
The solution of the equation f (x) = g (x) can be solved by graphical method.
Step 1: Draw the graphs of y = f (x) and y = g (x) on the same axes.
Step 2: The points of intersection of the graphs are the solutions of the equation f (x) = g(x). Read the values of x from the graph.
Solution of an Equation by Graphical Method
Example 1:
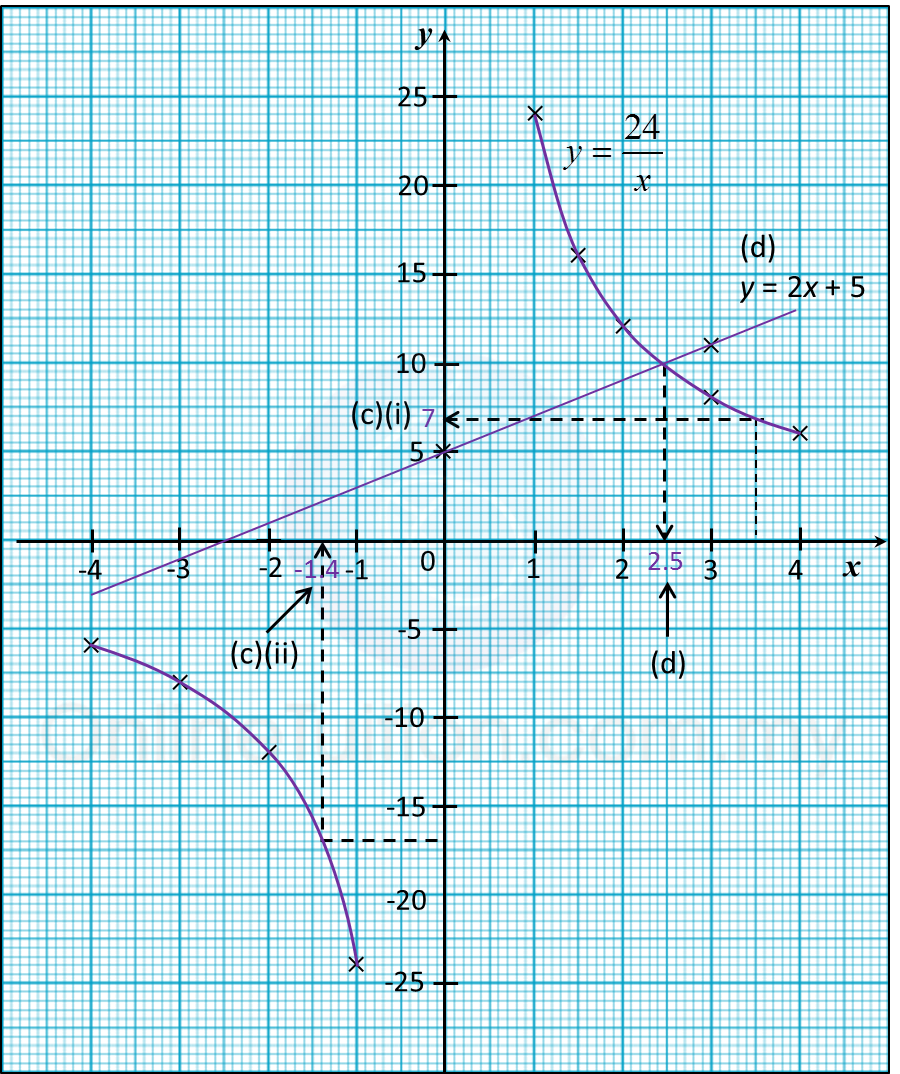
(c) From your graph, find
Solution:
(b)
(d)
Example 1:
(a) The following table shows the corresponding values of x and y for the equation y = 2x2 – x – 3.
x |
–2 |
–1 |
–0.5 |
1 |
2 |
3 |
4 |
4.5 |
5 |
y |
7 |
m |
– 2 |
–2 |
3 |
12 |
n |
33 |
42 |
Calculate the value of m and n.
(b) For this part of the question, use graph paper. You may use a flexible curve rule.
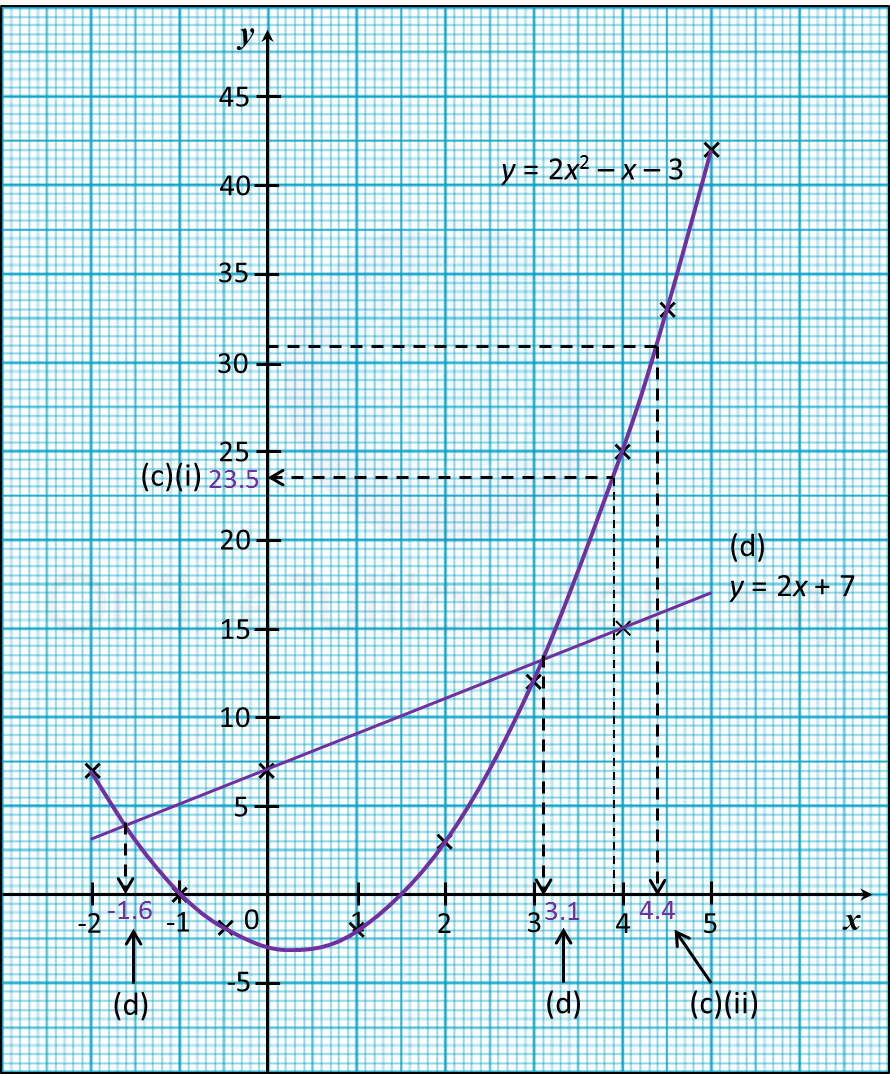
By using a scale of 2 cm to 1 unit on the x-axis and 2 cm to 5 units on the y-axis, draw the graph of y = 2x2 – x – 3 for –2 ≤ x ≤ 5.
(c) From your graph, find
(i) The value of y when x = 3.9,
(ii) The value of x when y = 31.
(d) Draw a suitable straight line on your graph to find the values of x which satisfy the equation 2x2 – 3x = 10 for –2 ≤ x ≤ 5.
Solution:
(a)
y = 2x2 – x – 3
when x = –1,
m = 2 (–1)2 – (–1) – 3 = 0
when x = 4,
n = 2 (4)2 – (4) – 3 = 25
(b)
(c)
(i) From the graph, when x = 3.9, y = 23.5
(ii) From the graph, when y = 31, x = 4.4
(d)
y = 2x2 – x – 3 ----- (1)
2x2 – 3x = 10 ----- (2)
y = 2x2 – x – 3 ----- (1)
0 = 2x2– 3x – 10 ------ (2) ← (Rearrange (2))
(1) – (2) : y = 2x + 7
The suitable straight line is y = 2x + 7.
Determine the x-coordinates of the two points of intersection of the curve
y = 2x2 – x – 3 and the straight line y = 2x+ 7.
x |
0 |
4 |
y = 2x + 7 |
7 |
15 |
From the graph, x = –1.6, 3.1