Question 10:
A set of data consists of twelve positive numbers.
Find
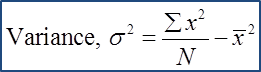
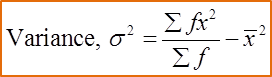
(a) the variance
(b) the mean
Solution:
(a)
(b)
A set of data consists of twelve positive numbers.
Find
(a) the variance
(b) the mean
Solution:
(a)
(b)
Question 11 (4 marks):
A set of data consists of 2, 3, 4, 5 and 6. Each number in the set is multiplied by m and added by n, where m and n are integers. It is given that the new mean is 17 and the new standard deviation is 4.242.
Find the value of m and of n.
Solution:
A set of data consists of 2, 3, 4, 5 and 6. Each number in the set is multiplied by m and added by n, where m and n are integers. It is given that the new mean is 17 and the new standard deviation is 4.242.
Find the value of m and of n.
Solution: