6.3 SPM Practice (Long Questions)


Question 12 (5 marks):
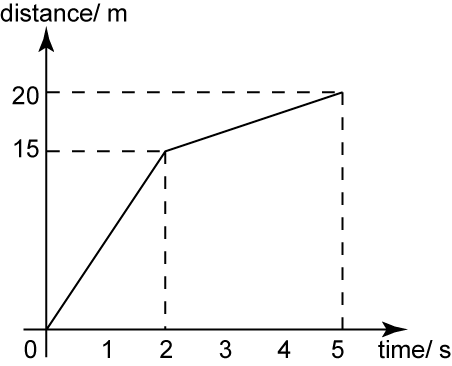
Diagram 7 shows a distance-time graph for the journey of a car from Kuala Lumpur to Ipoh.


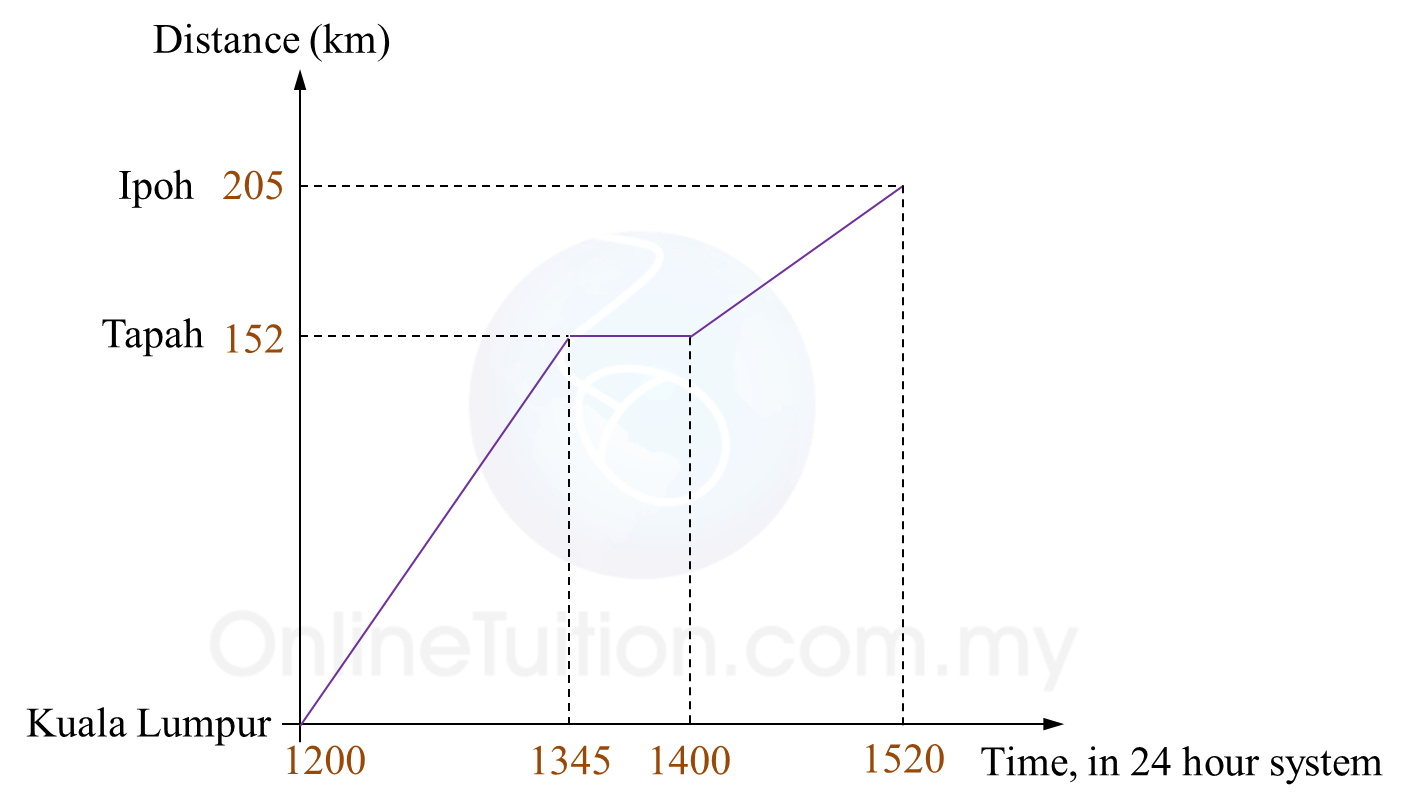
(a) State the duration of time, in minutes, the driver stopped and rest at Tapah.
(b) Calculate the speed, in kmh-1, of the car from Kuala Lumpur to Tapah.
(c) Calculate the average speed, in kmh-1, of the car for whole journey.


Solution:
(a)
1400 – 1345 = 15 minutes
The driver stopped and rest at Tapah for 15 minutes.


(b)

Speed=DistanceTimeSpeed=152 km134 h13451200=1 h 45 minsSpeed=86.86 kmh1Speed of the car from Kuala Lumpurto Tapah=86.86 kmh1


(c)

Average speed=Total distanceTime taken                  =205 km313 h15201200=3 h 20 minsAverage speed=61.5 kmh1Average speed of the car for thewhole journey=61.5 kmh1


6.3 SPM Practice (Long Questions)


Question 11 (6 marks):
Diagram 6 shows the distance-time graph of Ursula, Janet and Maria in a 100 m race.

Diagram 6


(a) Who won the race?

(b)
 During the race, Ursula slipped and fell over. After that, she continued her run.
State the duration, in seconds, before Ursula continued her run.

(c)
 During the race, Janet was injured and she stopped running.
State Janet's distance, in m, from the finishing line when she stopped running.

(d)
 Calculate the average speed, in ms-1, of Ursula.


Solution:
(a)
Maria won the race: 100 km in 16 seconds.

(b)
Duration before Ursula continued her run from slipping and falling over
= 18 seconds – 9 seconds
= 9 seconds

(c)
Janet's distance from the finishing line when she stopped running
= 100 m – 70 m
= 30 m

(d)
Average speed=DistanceTime                  =100 m20 s                  =5 ms1Average speed of Ursula=5 ms1

6.3 SPM Practice (Long Questions)


Question 9:
Diagram below shows the speed-time graph for the movement of an object for a period of 34 seconds.


(a) State the duration of time, in seconds, for which the object moves with uniform speed.
(b) Calculate the rate of change of speed, in ms-2, of the object for the first 8 seconds.
(c) Calculate the value of u, if the average of speed of the object for the last 26 seconds is 6 ms-1.

Solution:
(a) Duration of time = 26s – 20s = 6s

(b)Rate of change of speed for the first 8 seconds=10608=48=12 ms2

(c)Speed=DistanceTime(12×12×(6+u))+(6×u)+(12×8×u)26=6  36+6u+6u+4u=156   16u=120   u=7.5 ms1


Question 10 (6 marks):
Diagram 11 shows the speed-time graph for the movement of a particle for a period of t seconds.

Diagram 11

(a) State the uniform speed, in ms-1, of the particle.

(b)
 Calculate the rate of change of speed, in ms-2, of the particle in the first 4 seconds.

(c)
 Calculate the value of t, if the distance travelled in the first 4 seconds is half of the distance travelled from the 6th second to the tth second.


Solution:
(a)
 Uniform speed of the particle = 12 ms-1

(b)
Rate of change of speed of particle=124=3 ms2

(c)
Distance travelled in the first 4 seconds =12(Distance travelled from the 6th second to tth second)12×4×12=12[12(12+20)(t6)]24=12[16(t6)]24=8(t6)24=8t483=t6t=9

6.3 SPM Practice (Long Questions)


Question 7:


The diagram above shows the speed-time graph of a moving object for 15 seconds. Find
(a)    the speed of the object at t = 9s.
(b)   the distance travel by the object for the first 12 seconds.

Solution:

(a)
The speed of the object at t = 9s is 6 ms-1

(b)
Distance travel by the object for the first 12 seconds
= Area under the speed-time graph
= Area of triangle
= ½ × 12 × 8
= 48 m


Question 8:


The diagram above shows the speed-time graph of a moving object for 15 seconds.
(a) Find the time interval when the object moves with constant speed.
(b) Find the acceleration from t = 6 s to t = 12 s.
(c) State the time when the object is stationary.

Solution:

(a)
Time interval when the object moves with constant speed
= 12 – 6
= 6 s

(b)
Acceleration from t=6s to t=12s= Gradient of speed-time graph=66126=0 ms2The moving object is moving at a uniform speed

(c)

Time when the object is stationary is at 15 s.


6.2 Quantity Represented by the Area under a Graph (Part 2)


Combination of Graphs
Example 2:

 
The diagram above shows the speed-time graph of a moving object for 15 seconds.
(a) State the length of time, in s, that the particle moves with constant speed.
(b) Calculate the rate of change of speed, in ms-2, in the first 3 seconds.
(c) Calculate the average speed of the object in 15 seconds.

Solution:
 
(a)
Length of time that the particle moves with constant speed
= 9 – 3 = 6 s 

(b)
Rate of change of speed in the first 3 seconds
= acceleration = gradient
=y2y1x2x1=6330=1ms2

(c)

Total distance travelled of the object in 15 seconds
= Area under the graph in the 15 seconds
= Area P + Area Q + Area R
=[12(3+6)×3]+[(93)×6]+[12(159)×6]=13.5+36+18=67.5 m

Average speed of the object in 15 seconds
=Total distance travelledTotal time taken=67.515=4.5 ms1

6.2 Quantity Represented by the Area under a Graph (Part 1)


6.2 Quantity Represented by the Area under a Graph (Part 1)
1. In the speed-time graph,
(a) Quantity represented by the gradient of the graph is acceleration or the rate of change of speed.
(b) Quantity represented by the area under the graph is distance.


Example 1:
Calculate the distance of each of the following graphs.
(a)

Distance = Area under the speed-time graph = Area of a triangle
Distance=12×base×height=12×7×6=21m

(b)

Distance = Area under the speed-time graph = Area of a rectangle
Distance = Length × Breadth
= 6 × 4 = 24 m

(c)


Distance = Area under the speed-time graph = Area of a trapezium

Distance=12(a+b)hArea of trapezium=12×Sum of the twoparallel sides×Height=12(4+6)×8=40m

6.1 Quantity Represented by the Gradient of a Graph (Part 2)


(B) Speed – Time Graph
1. The gradient of a speed-time graph is the rate of change of speed or acceleration.


2.


(a) From O to P: Gradient = positive → (Speed of object increasing or accelerating).

(b) 
From P to Q: Gradient = 0 → (Object is moving at uniform speed).

(c) 
From Q to R: Gradient = negative → (Speed of object decreasing or decelerating).


Example:


The diagram above shows the speed-time graph of a moving car for 5 seconds. Find
(a) the rate of speed change when the car travel from X to Y.
(b) the rate of speed change when the car travel from Y to Z.
 
Solution:
(a)
Rate of speed change when the car travels from X to Y
= Gradient
=y2y1x2x1=52040=154ms2Negative gradient indicatesthat the speed is decreasing.

(b)
Rate of speed change when the car travels from Y to Z
= Gradient
=y2y1x2x1=10554=5ms2

6.3 SPM Practice (Long Questions)


Question 1:


The diagram above shows the distance-time graph of a moving particle for 5 seconds. Find
(a) the distance travel by the particle from the time 2 second to 5 second.
(b)   the speed of the particle for the first 2 seconds.

Solution:

(a)
Distance travel by the particle from the time 2 second to 5 second
= 20 – 15
= 5 m

(b)
The speed of the particle for the first 2 seconds
= Gradient 
=15020=7.5ms1


Question 2:


The diagram above shows the distance-time graph of a moving car for 12 seconds. Find
(a)    the value of v, if the average speed of the car for the first 6 seconds is 2 ms-1.
(b)   average speed of the car for the first 8 seconds.

Solution:

(a)
Average speed of the car for the first 6 seconds is 2 ms-1Total distance travelledTotal time taken=2v6=2v=12

(b)
Average speed of the car for the first 8 seconds=158=1.875 ms1


6.3 SPM Practice (Long Questions)


Question 3:
Diagram below shows the distance-time graph for the journey of a train from one town to another for a period of 90 minutes.


(a) State the duration of time, in minutes, during which the train is stationery.
(b) Calculate the speed, in km h-1, of the train in the first 40 minutes.
(c) Find the distance, in km, travelled by the train for the last 25 minutes.

Solution:
(a) Duration the train is stationery = 65 – 40 = 25 minutes

(b)Speed of the train in the first 40 minutes=15090 km40 minutes=60 km4060 h=90 km / h

(c) 90 – 0 = 90 km


Question 4:


The diagram above shows the speed-time graph of a moving particle for 10 seconds. From the graph above, find
(a) the total distance travel by the particle for the whole journey.
(b)   the average speed for the whole journey.
 
Solution:
(a)
Total distance travelled
= Area under the speed-time graph
= Area of triangle
= ½ × 15 × 10
= 75 m

(b)
Average speed for the whole journey
=Total distance travelledTotal time taken=7510=7.5ms1

6.3 SPM Practice (Long Questions)


Question 5:


The diagram above shows the speed-time graph of a moving particle for 12 seconds. Find
(a) the length of the time, in s that the particle move with uniform speed.
(b)   the distance travel by the particle when it move with constant speed.
(c)  the distance travel by the particle when the rate of the speed change is negative.

Solution:

(a)
Length of the time the particle move with uniform speed
= 10 – 6
= 4 s

(b)

Distance travel by the particle when it move with constant speed
= Area under the speed-time graph
= Area of rectangle
= 4 × 10
= 40 m

(c)
Distance travel by the particle when the rate of the speed change is negative
= Area under the speed-time graph for the first 6 s
= Area of trapezium
= ½ (10 + 25)(6)
= 105 m


Question 6:
Diagram below shows the speed-time graph for the movement of an object for a period of 40 seconds.


(a) State the duration of time, in s, for which the object moves with uniform speed.
(b) Calculate the rate of change of speed, in ms-2, of the object for the last 12 seconds.
(c) Calculate the value of v, if the total distance travelled for the period of 40 seconds is 500 m.

Solution:
(a) Duration of time the object moves with uniform speed = 28s – 10s = 18s

(b)Rate of change of speed=1512ms2=1.25 ms2(c)Area of trapezium I + Area of trapezium II=50012(v+15)10+12(18+30)15=500   5v+75+360=5005v=65  v=13