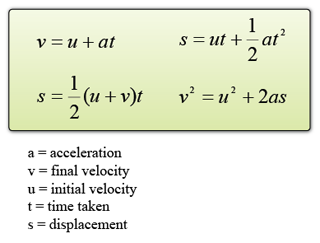
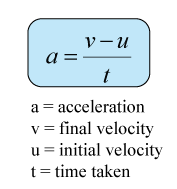
Equation of Uniform Acceleration
Most of the motion problems can be solved by the following equations. Therefore, make sure that you memorise all of them.
How we know when to use the equation?
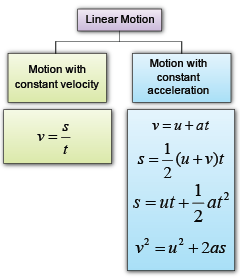
There are 3 types of motion:
- motion with uniform velocity
- motion with uniform acceleration
- motion with changing acceleration
The 4 equations are used when the motion is uniform acceleration.
Motion with changing acceleration is not in SPM Physics syllabus. It will be discussed in Form 5 add maths.
Example 1:
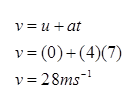
An object accelerates from stationary with the acceleration of 4 ms-2. What is the velocity of the object after 7s?
Answer:
It's advisable to list down all the information that we have.
Initial velocity, u = 0 (Because the motion start from stationary)
Acceleration, a = 4 ms-2
Time taken, t = 7s
Final velocity, v = ?
The displacement, s, is not involved, hence we select the equation (v = u + at) to solve the problem.
Example 2
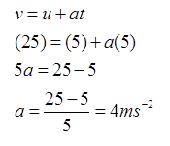
A car is moving with velocity 5ms-1 reaches a velocity of 25ms-1 in 5s. What is the acceleration of the car?
Answer:
It's advisable to list down all the information that we have.
Initial velocity, u = 5ms-1
Final velocity, v = 25ms-1
Time taken, t = 5s
Acceleration, a = ?
The displacement, s, is not involved, hence we select the equation (v = u + at) to solve the problem.
Example 3
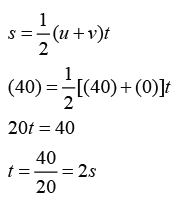
A cyclist riding at a speed of 40 ms-1 braked with uniform acceleration and stopped in 40m. How long did he take to stop?
Answer:
It's advisable to list down all the information that we have.
Initial velocity, u = 40 ms-1
Final velocity, v = 0 (Because the cyclist stop)
Displacement, s = 40m
Time taken, t = ?
The acceleration, a, is not involved, hence we select the equation  to solve the problem.
Example 4
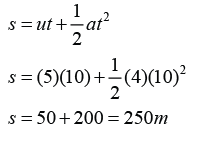
A car is accelerated at 4 ms-2 from an initial velocity of 5 ms-1 for 10 seconds. What is the distance traveled by the car?
Answer:
It's advisable to list down all the information that we have.
Acceleration, a = 4 ms-2
Initial velocity, u = 5
Time taken, t = 10s
Displacement, s = ?
The final velocity, v, is not involved, hence we select the equation 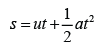 to solve the problem.
Example 5
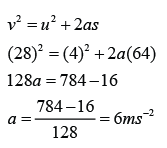
A car accelerates from 4 ms-1 reaches a velocity of 28 ms-1 after traveling for 64m. What is the deceleration of the car?
Answer:
It's advisable to list down all the information that we have.
Initial velocity, u = 4 ms-1
Final velocity, v = 28 ms-1
Displacement, s = 64m
Acceleration, a = ?
The time taken, t, is not involved, hence we select the equation v² = u² + 2as to solve the problem.


