Question 1:
Solution:
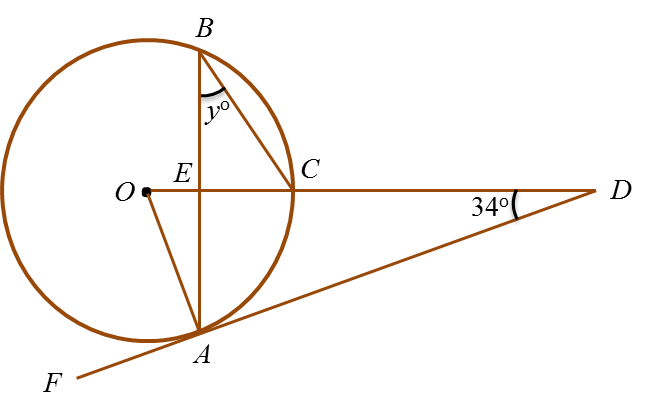
In figure above, FAD is a tangent to the circle with centre O. AEB and OECD are straight lines. The value of y is
Solution:
∠OAD = 90o
∠AOD= 180o – 90o – 34o= 56o
y = 56o ÷ 2 = 28o
Question 2:
Solution:
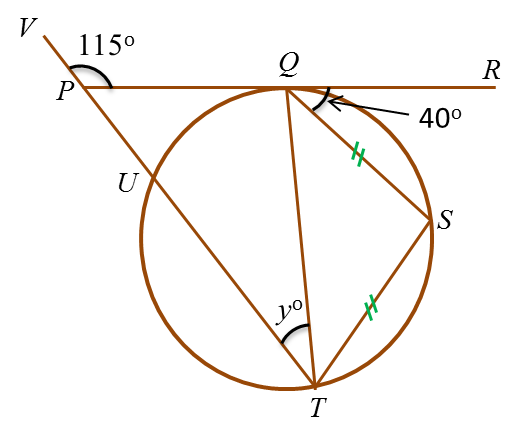
In figure above, PQR is a tangent to the circle QSTU at Q and TUPV is a straight line. The value of y is
Solution:
∠QTS = ∠RQS = 40o
∠SQT= ∠QTS = 40o (isosceles triangle)
∠PQT= 180o – 40o – 40o= 100o
∠TPQ= 180o – 115o = 65o
y = 180o – 100o – 65o= 15o
Question 3:
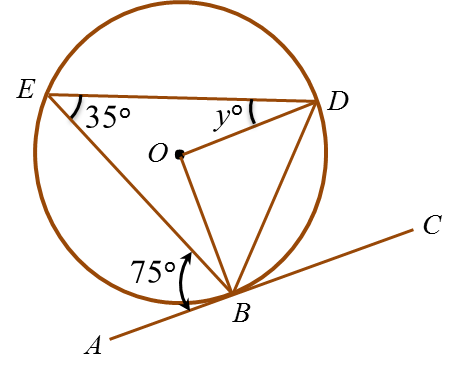
Solution:
In figure above, ABC is a tangent to the circle BDE with centre O, at B.
Find the value of y.
∠BOD= 2 × ∠BED
= 2 × 35o = 70o
∠ODB = ∠OBD
= (180o – 70o) ÷ 2 = 55o
∠ EDB = ∠ EBA = 75o
yo + ∠ ODB = 75o
yo + 55o = 75o
y = 20o