SPM Practice 3 (Linear Law) – Question 3

Question 3
The table below shows the values of two variables, x and y, obtained from an experiment. The variables x and y are related by the equation a y = b x + 1 , where k and p are constants.


(a) Based on the table above, construct a table for the values of 1 x and 1 y . Plot 1 y against 1 x , using a scale of  2 cm to 0.1 unit on the 1 x - axis and  2 cm to 0.2 unit on the 1 y - axis. Hence, draw the line of best fit.
(b) Use the graph from  (b)  to find the value of
(i)  a,
(ii)  b.


Solution

Step 1 : Construct a table consisting X and Y.


Step 2 : Plot a graph of Y against X, using the scale given and draw a line of best fit

Steps to draw line of best fit - Click here


Step 3 : Calculate the gradient, m, and the Y-intercept, c, from the graph


Step 4 : Rewrite the original equation given and reduce it to linear form

Step 5 : Compare with the values of m and c obtained, find the values of the unknown required

Steps To Draw The Line Of Best Fit

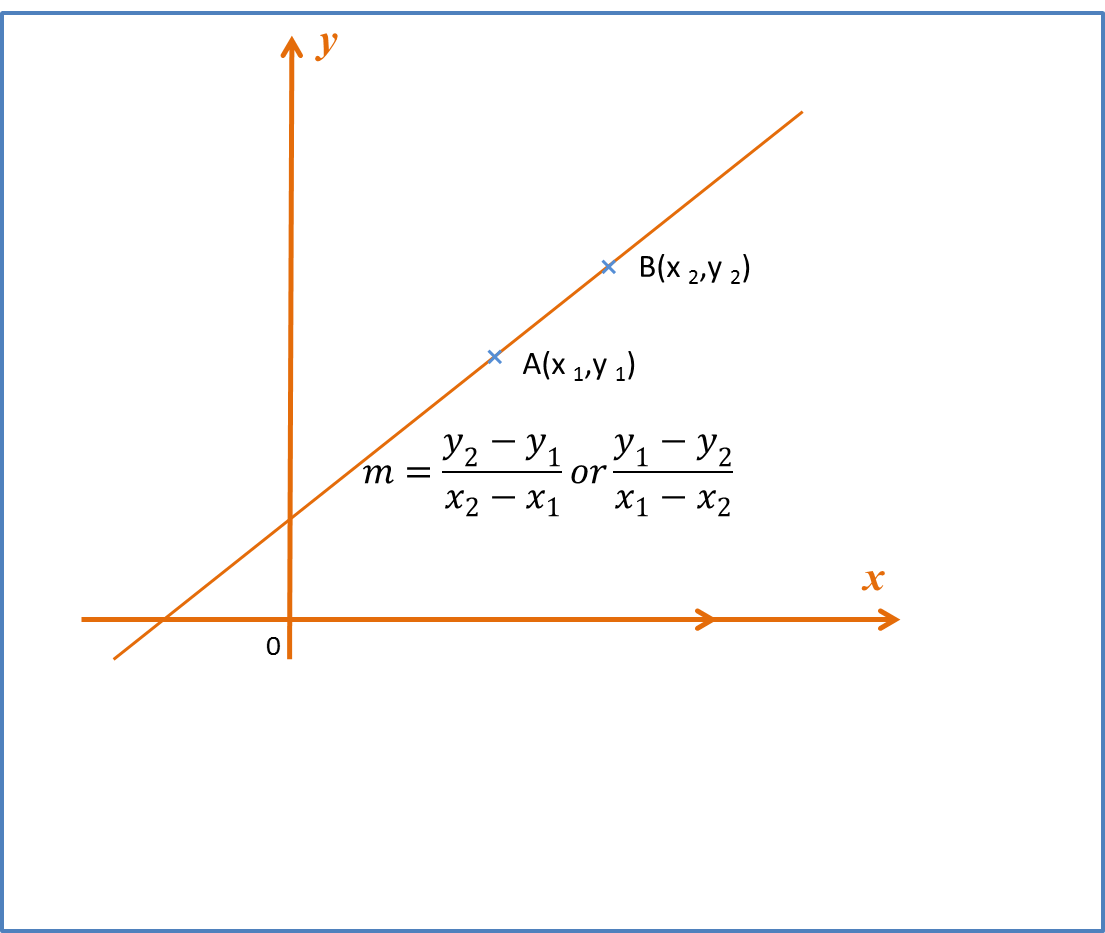
Steps to draw a line of Best Fit
(i) Select suitable scales for the x-axis and the y-axis, make sure the points plotted accurately and the graph produced is large enough on the graph paper,
(ii) 
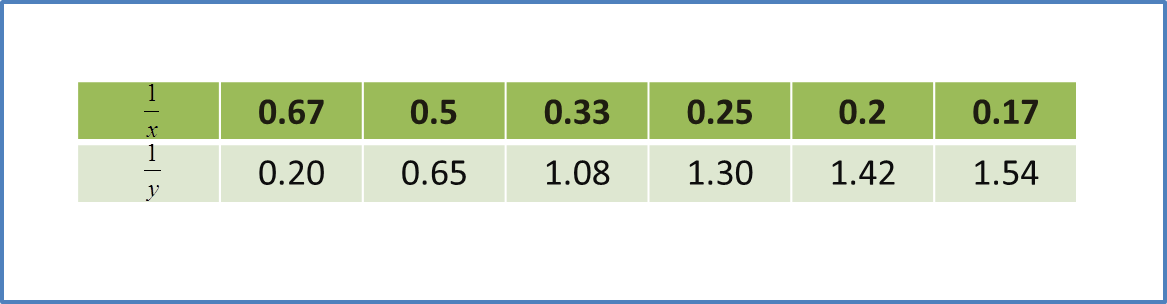
Mark the points correctly,
(iii) 
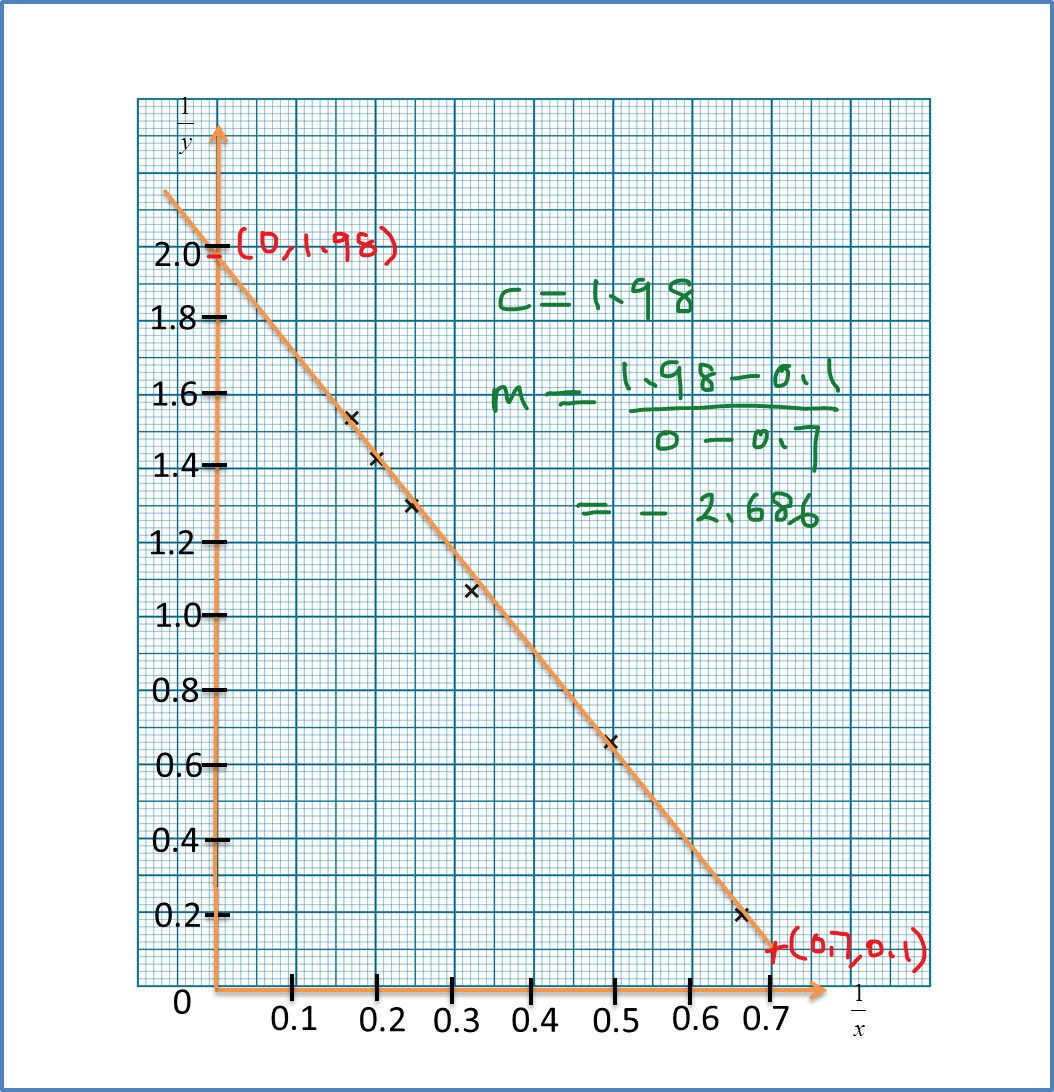
Use a long and transparent ruler to draw the line of best fit.

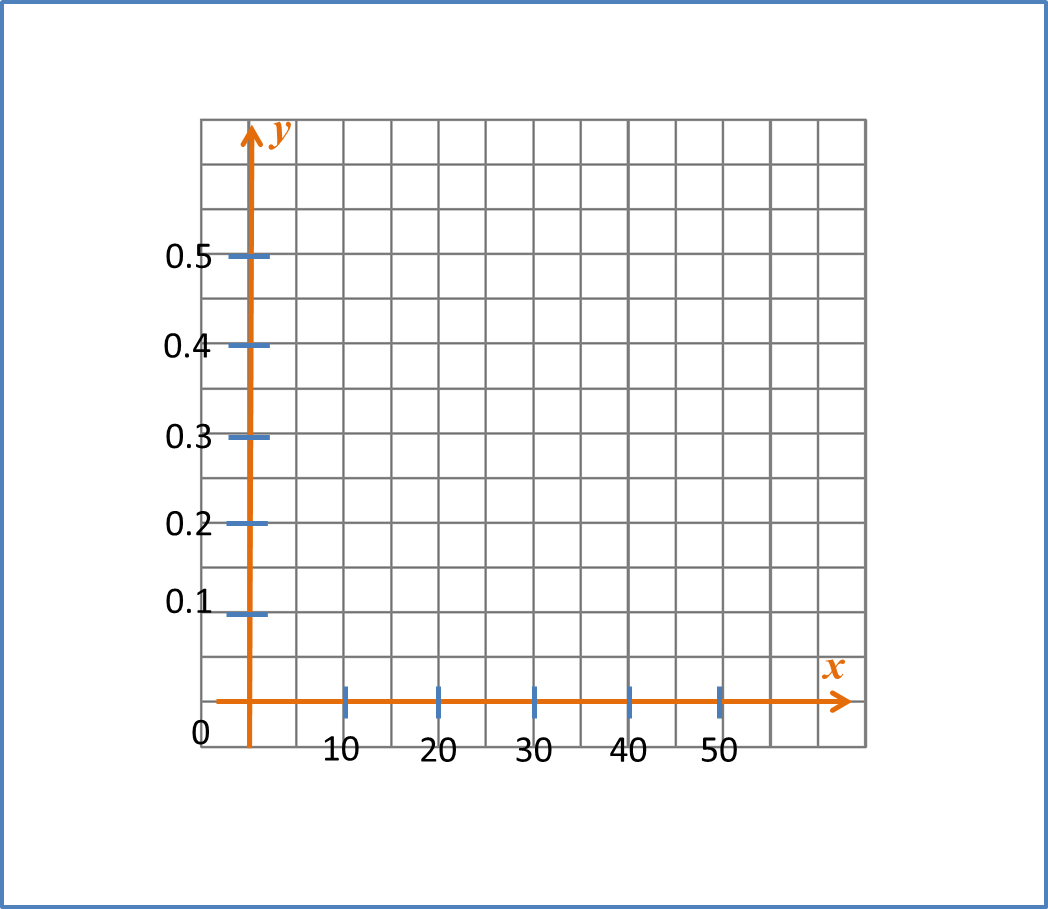
Step 1 : Select the suitable scale on x and y axis 

(the graph produced must be more than 50% of the graph paper)


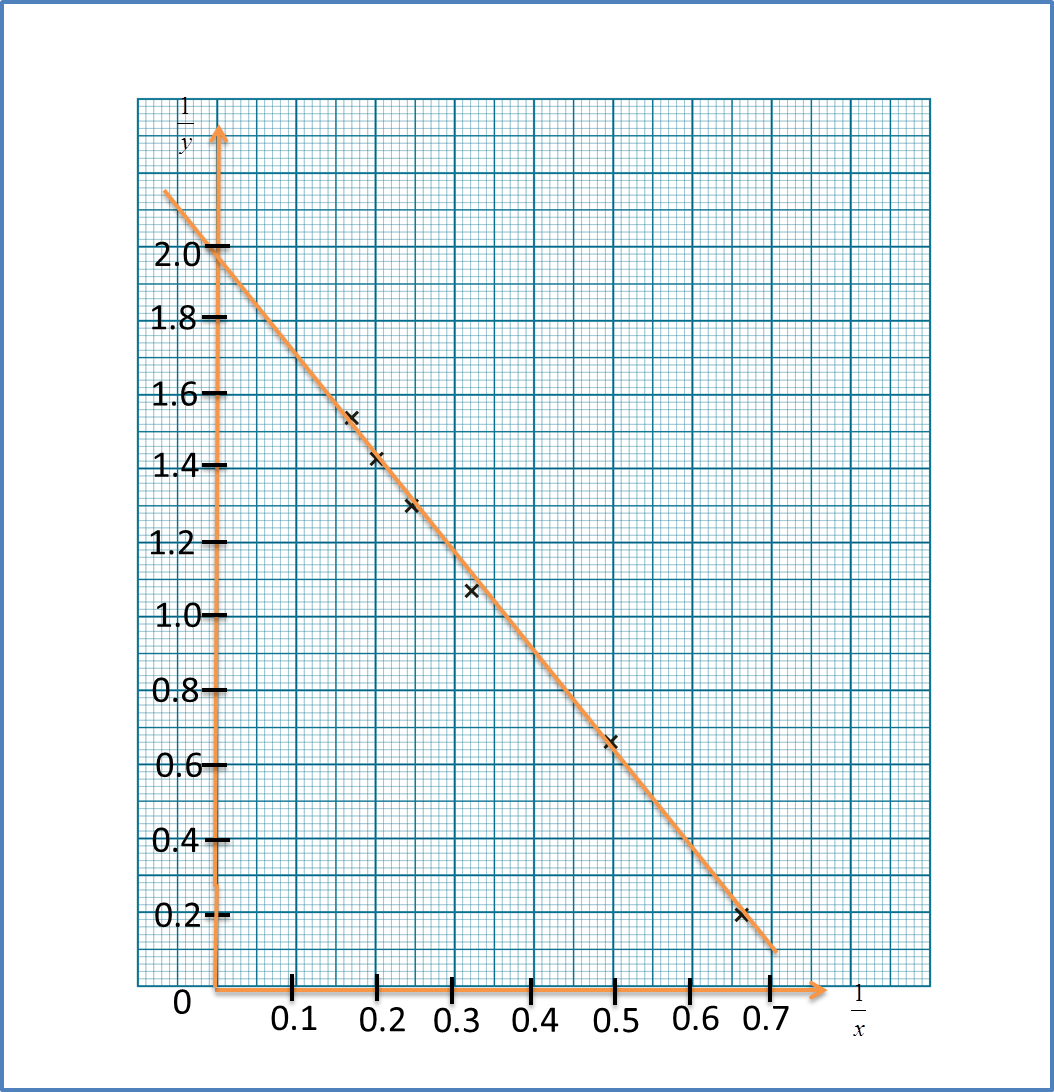
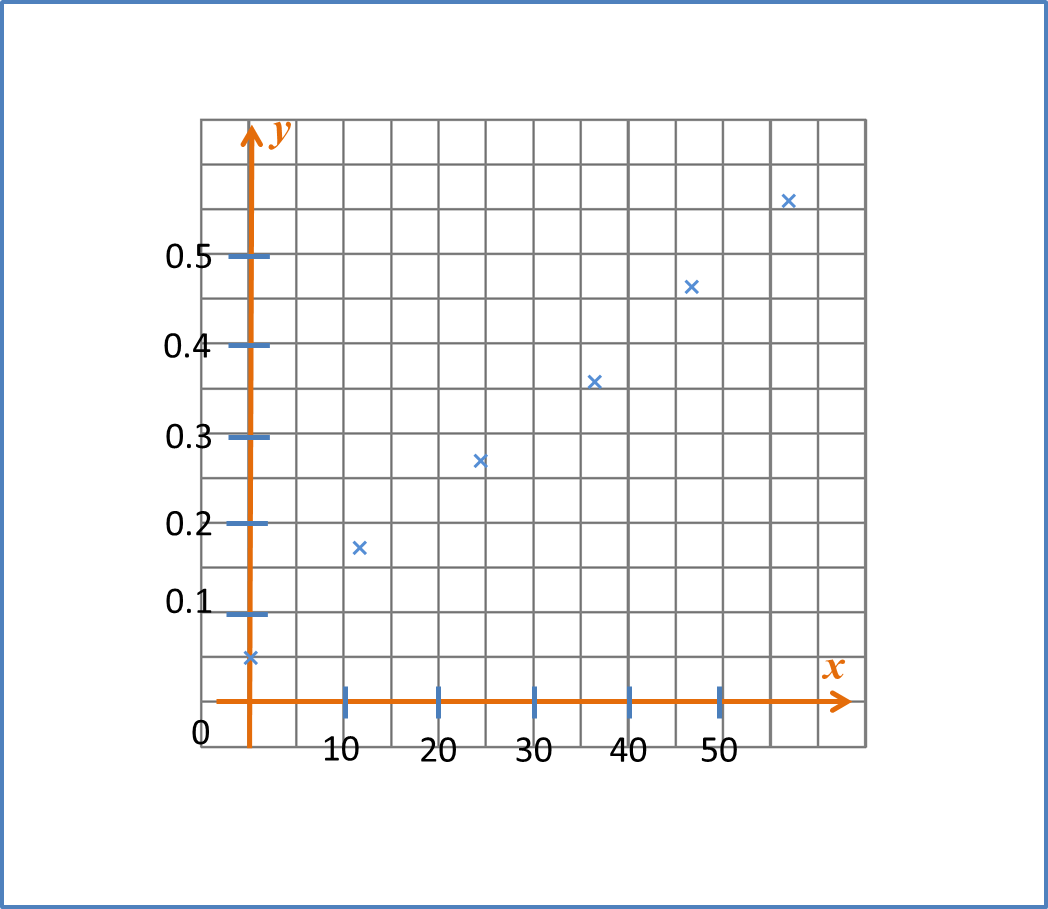
Step 2 : Mark the points correctly


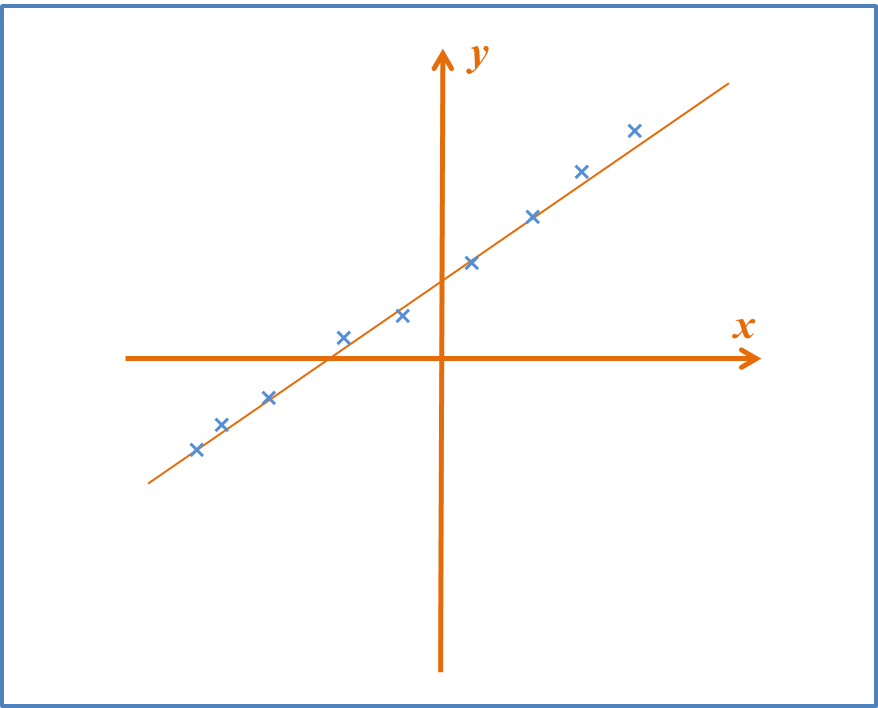
Step 3 : Draw the Line of Best Fit
 
* Note
 -the line passes through four points 
-one point is above the line
-one point is below the line


Equations Of Line Of Best Fit


A set of two variables are related non linearly can be converted to a linear equation.  The line of best fit can be written in the form

Y = mX + c


where
X and Y are in terms of x and/or y
m is the gradient,
c is the Y-intercept

Recall: To find equation of straight line
(1)  Equation of a straight line if gradient (m) and one points ( x 1 , y 1 ) are given:
Y y 1 = m ( X x 1 )
(2)  Equation of a straight line if gradient (m) and y-intercept (c) are given:
Y = m X + c

Reduce Non-Linear Function To Linear Function – Examples (A) To (F)

Examples:
Reduce each of the following equations to the linear form. Hence, state the gradient and the Y-intercept of the linear equations in terms of  a and b.
(a)  y = a x 3 + b x 2
(b)  y = a x + b x
(c)  y = a x b x 2
(d)  x y = p x + q x
(e)  y = a x + b x
(f)  a y = b x + 1

[Note :
X and Y cannot have constant, but can have the variables (for example x and y)
 m and c can only have the constant(for example a and b), cannot have the variables x and y]

Solution:


The Line Of Best Fit

2.2 The Line of Best Fit

Line of best fit 
has 2 characteristics:
(i) it passes through as many points as possible,
(ii) the number of points which are not on the line of best fit are equally distributed on the both sides of the line.

Example
Check whether the following graph has the characteristic of the line of best fit

(a)


Yes! This is the Line of Best Fit
.
Notice that you have 3 points passes through the straight line,1 points above the line and 1 point below the line. The number of points which are not on the line of best fit are equally distributed on the both sides of the line.

(b)


No. This is NOT the Line of Best Fit
.
Notice you have more points above the line than below the line. The number of points which are not on the line of best fit are NOT equally distributed on the both sides of the

SPM Practice 3 (Linear Law) – Question 2


Question 2 (10 marks):
Use a graph to answer this question.
Table shows the values of two variables, x and y, obtained from an experiment. A straight line will be obtained when a graph of y 2 x  against  1 x is plotted.


(a) Based on Table, construct a table for the values of 1 x  and  y 2 x .  
( b ) Plot  y 2 x  against  1 x , using a scale of 2 cm to 0.1 unit on the  1 x -axis   and 2cm to 2 units on the  y 2 x -axis.   Hence, draw the line of best fit.

(c) Using the graph in 11(b)
(i) find the value of y when x = 2.7,
(ii) express y in terms of x.

Solution:
(a)


(b)


(c)(i)
When x=2.7,  1 x =0.37 From graph, y 2 x =5.2 y 2 2.7 =5.2 y=3.75


(c)(ii)

Form graph, y-intercept, c = –4 gradient, m= 16( 4 ) 0.80 =25 Y=mX+c y 2 x =25( 1 x )4 y= 254x


Revise of Important Concept – Straight Line


(A) Equation of a straight Line 

 An equation of straight line is given by y = mx + c.
The variables x and y are linearly related
The term c is known as y-intercept. It represents the y value where the line cuts the y-axis
The term m is the gradient of the straight line and its value is constant


(B) Gradient of a Straight Line
If the points A ( x 1 , y 1 )  and B ( x 2 , y 2 )   lie on the straight line y = m x + c , then gradient of ,the straight line
m = y 2 y 1 x 2 x 1 o r y 1 y 2 x 1 x 2


(C) Mid Point 


Mid Point AB is given by M = ( x 1 + x 2 2 , y 1 + y 2 2 )


(D) Distance Between Two Points
Distance between point A ( x 1 , y 1 ) and point is B ( x 2 , y 2 ) given by ( x 1 x 2 ) 2 + ( y 1 y 2 ) 2