Question 5:
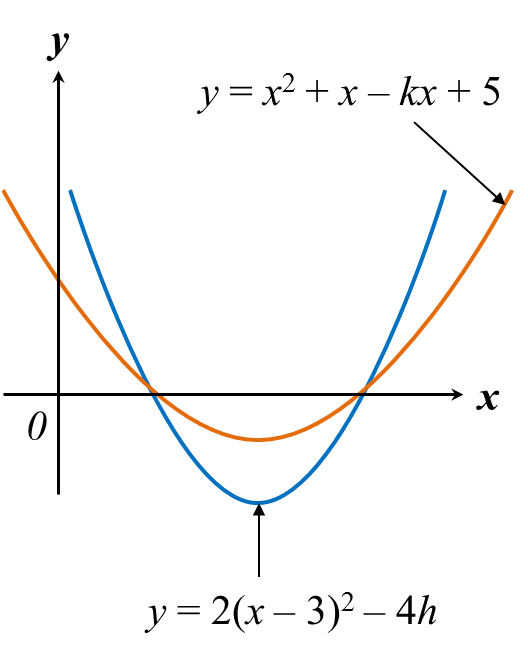
Diagram above shows the graphs of the curves y = x2 + x – kx + 5 and y = 2(x – 3) – 4h that intersect the x-axis at two points. Find
(a) the value of k and of h,
(b) the minimum value of each curve.
Solution:
(a)
y=x2+x−kx+5=x2+(1−k)x+5=[x+(1−k)2]2−(1−k2)2+5axis of symmetry of the graph isx=−(1−k)2
y=2(x−3)2−4haxis of symmetry of the graph is x=3.∴
(b)