4.2.2 Statistics (II), PT3 Focus Practice
Question 6:
Diagram below is a pie chart which shows the proportion of money allocated to five clubs.
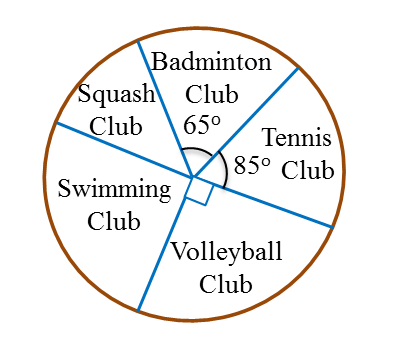
The total amount of money allocated to Swimming Club and Squash Club is RM1800.
Calculate the total amount of money allocated to the five clubs.
Solution:
Sum of the angles of the sectors for Swimming Club and Squash Club
= 360o – 65o – 85o – 90o
= 120o
Total amount of money allocated to the five clubs
Question 7:
Table below shows the number of students who watch four different TV channels in a week.
|
TV Channels
|
Number of Students
|
|
News
|
8
|
|
Sports
|
15
|
|
Movies
|
25
|
|
Music
|
12
|
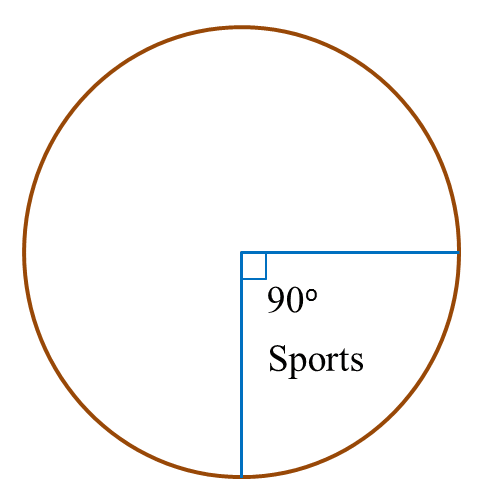
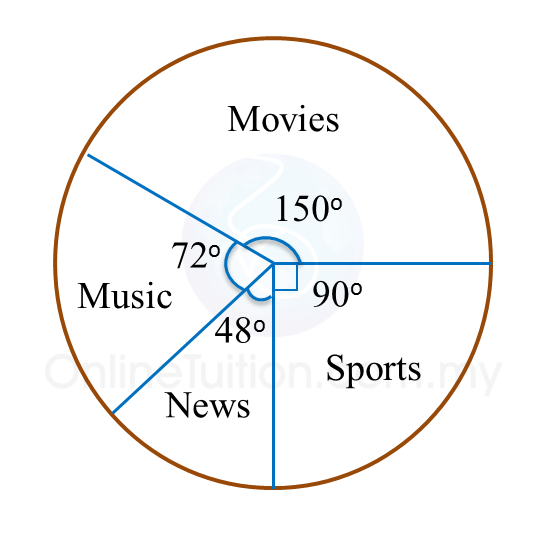
The information for sports channel is shown fully in the pie chart in the answer space.
Complete the pie chart to represent all the information in the Table.
Answer:
Solution:
Total number of students
= 8 + 15 + 25 + 12 = 60
Question 8:
Diagram below is a pie chart showing the number of mangosteens eaten by 4 boys.
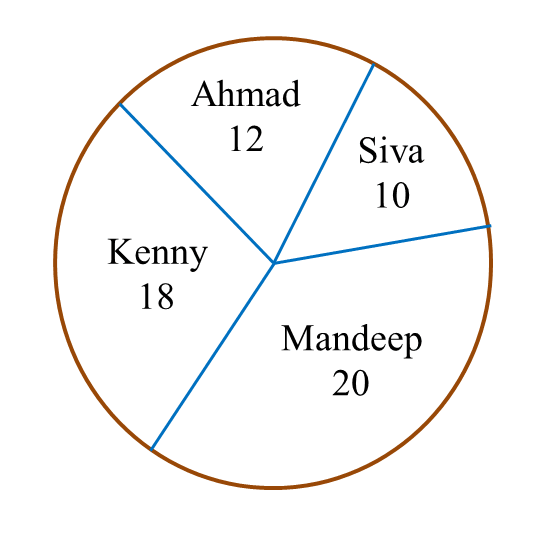
Calculate
(a) the mean number of mangosteens eaten by a boy,
(b) the angle of the sector representing Kenny.
Solution:
(a)
(b)

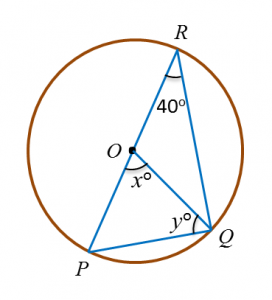

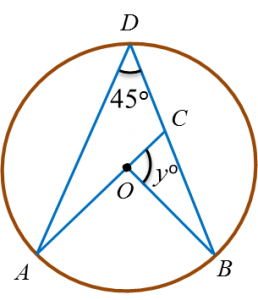
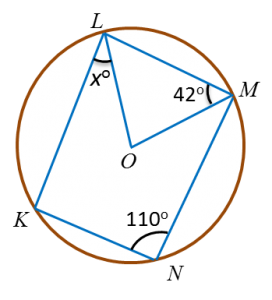
 Find the value of x.
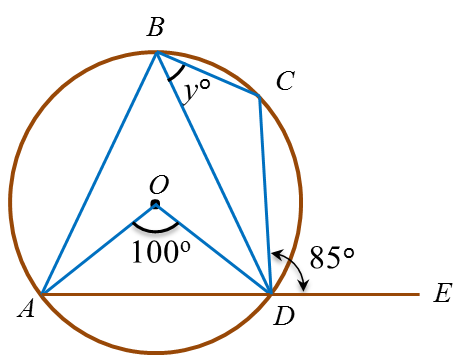
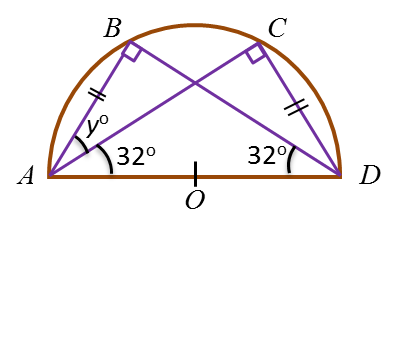
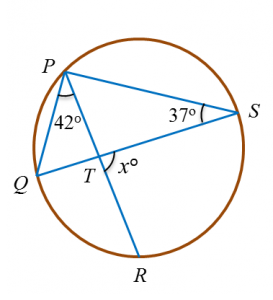
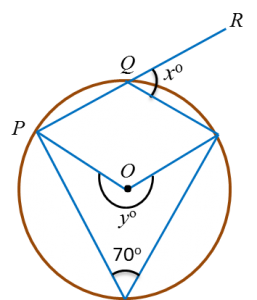
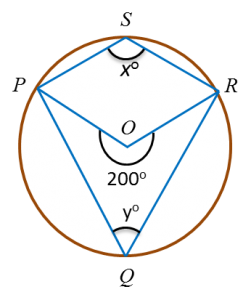
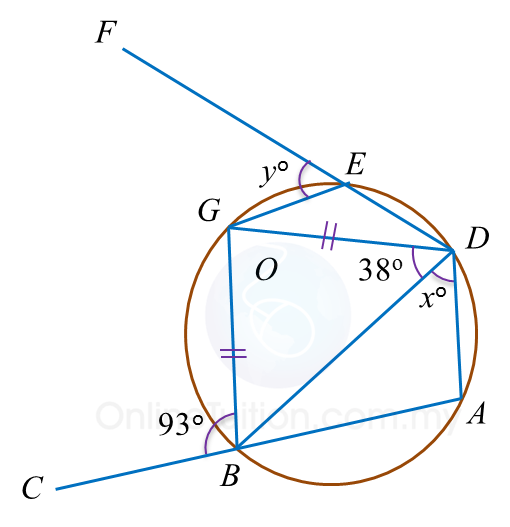
 Find the value of x and of y.
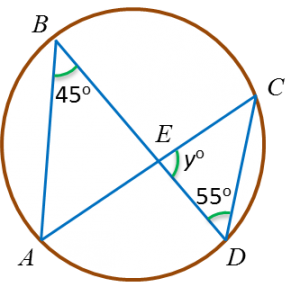
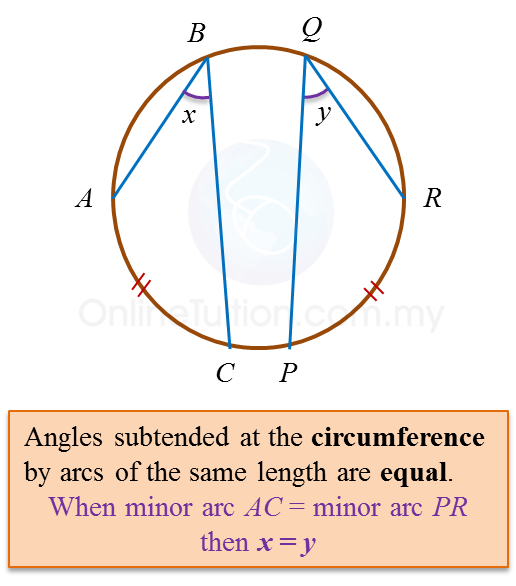
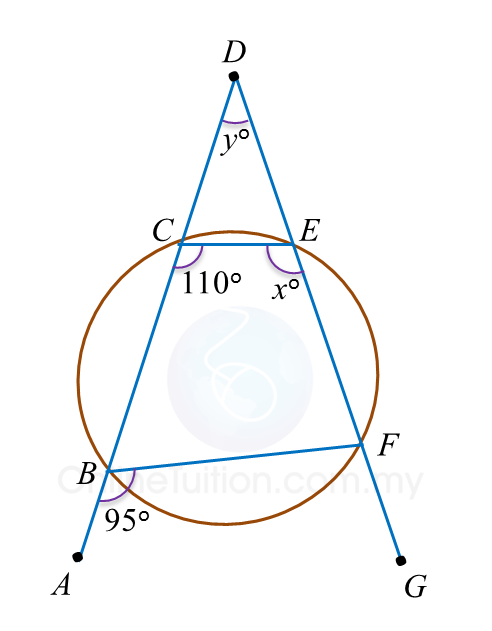