Question 7:
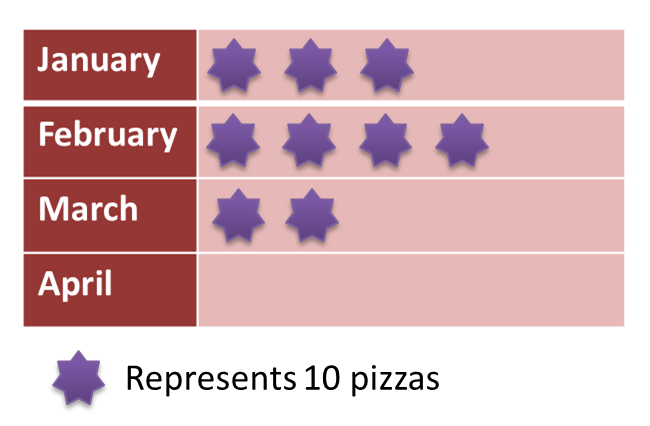
Diagram below is an incomplete pictograph showing the sales of books for a duration of five months.
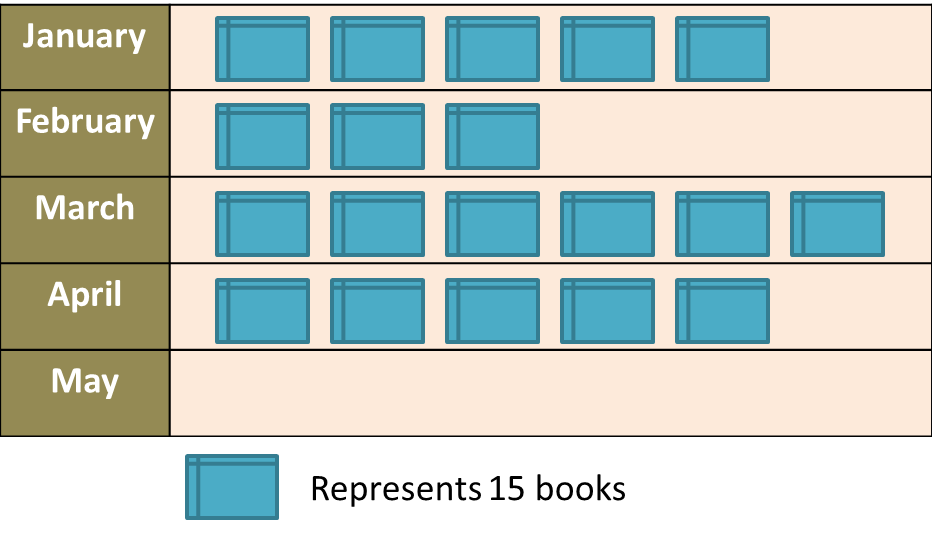
(a) The sales in May is ¼ of the total sales in January and February.
Complete the pictograph in the Diagram.
(b) Find the total number of books sold before April.
Solution:
(a)
(b)
Total number of books sold before April
= (5 + 3 + 6) × 15
= 14 × 15
= 210
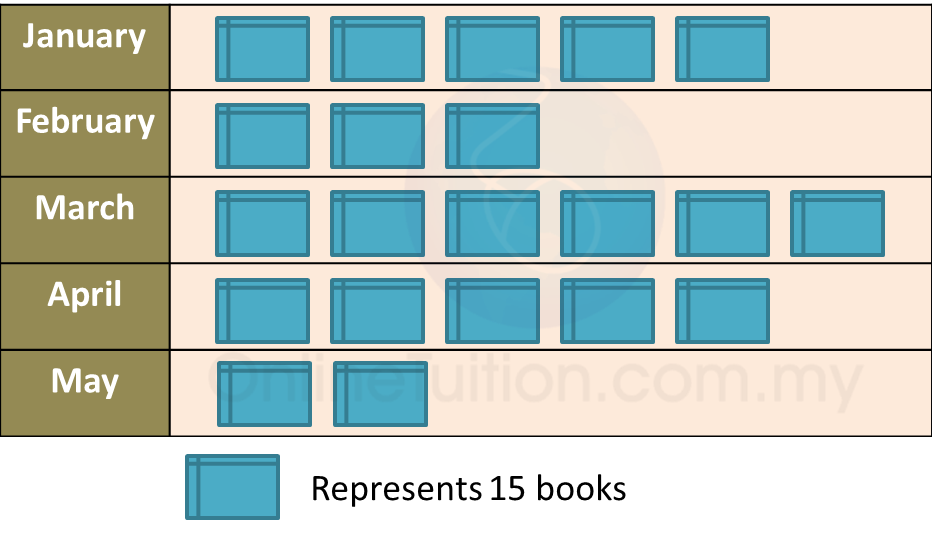
Diagram below is an incomplete pictograph showing the sales of books for a duration of five months.
(a) The sales in May is ¼ of the total sales in January and February.
Complete the pictograph in the Diagram.
(b) Find the total number of books sold before April.
Solution:
(a)
(b)
Total number of books sold before April
= (5 + 3 + 6) × 15
= 14 × 15
= 210
Question 8:
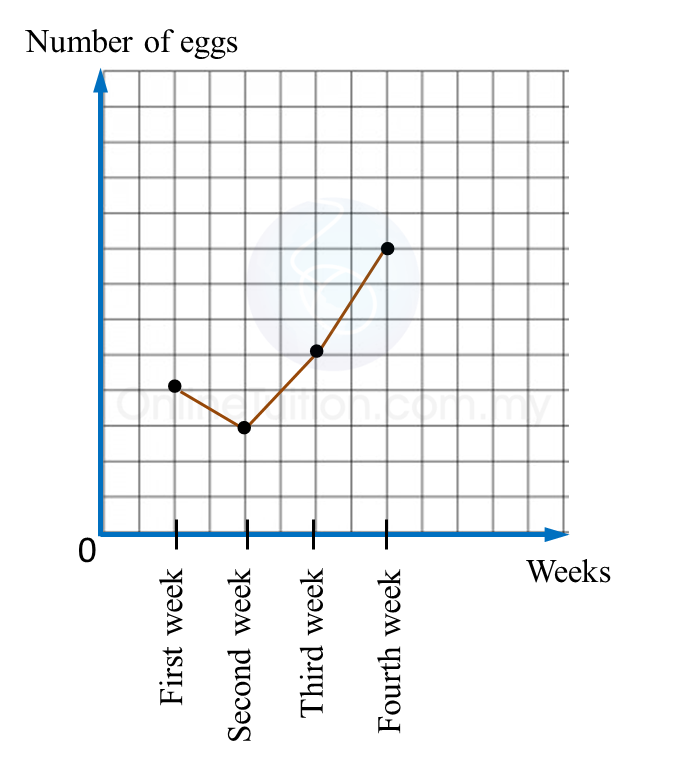
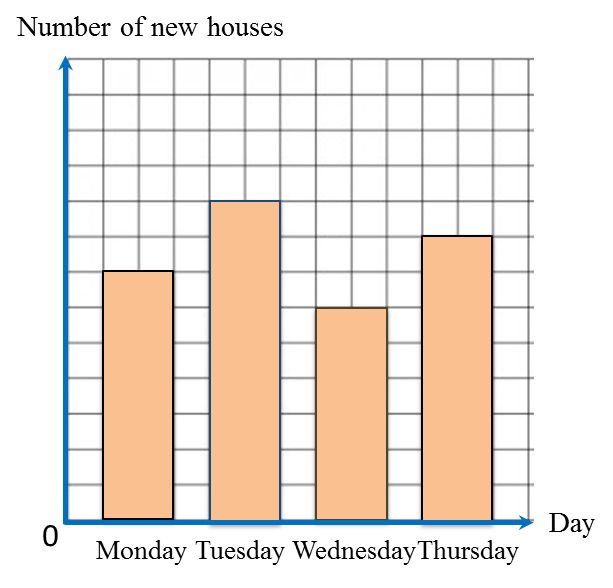
Diagram below shows an incomplete line graph of the number of eggs sold in four weeks. The number of eggs sold on week 1 is 2000 and 4000 on week 4.
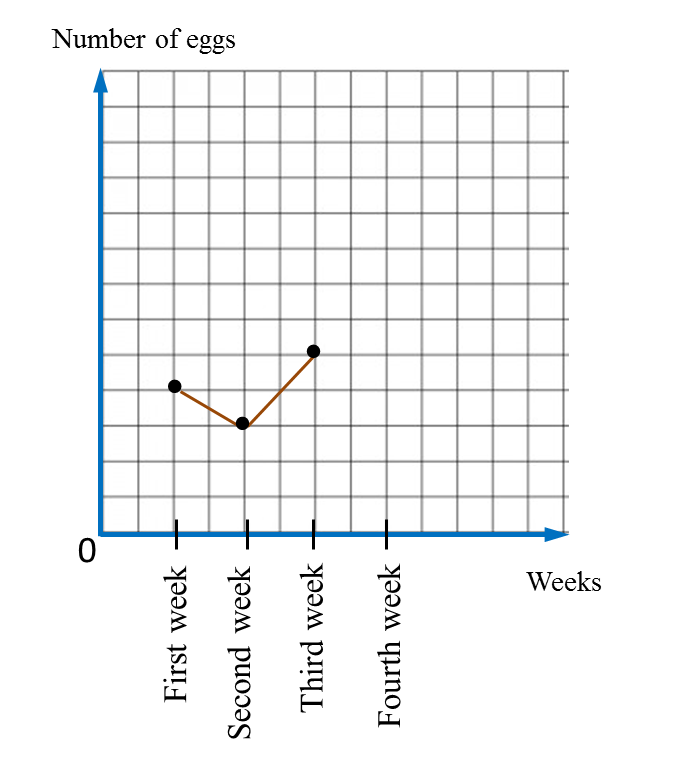
(a) Complete the line graph in the Diagram.
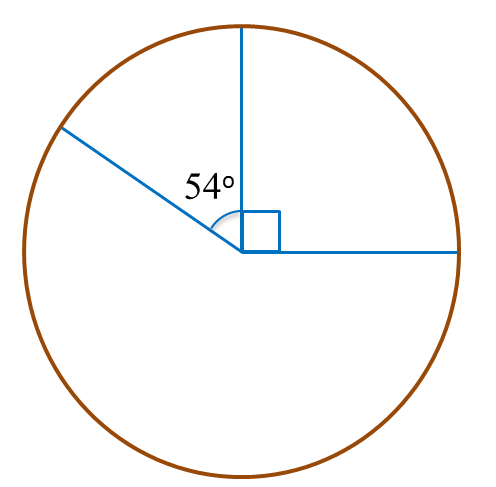
(b) Complete the pie chart in the second Diagram to represent sales from Week 1 to Week 4.
Solution:
(a)
(b)
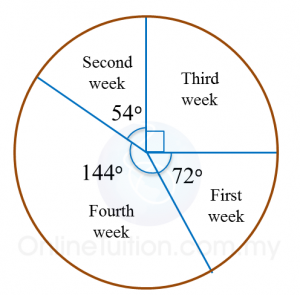
Diagram below shows an incomplete line graph of the number of eggs sold in four weeks. The number of eggs sold on week 1 is 2000 and 4000 on week 4.
(a) Complete the line graph in the Diagram.
(b) Complete the pie chart in the second Diagram to represent sales from Week 1 to Week 4.
Solution:
(a)
(b)
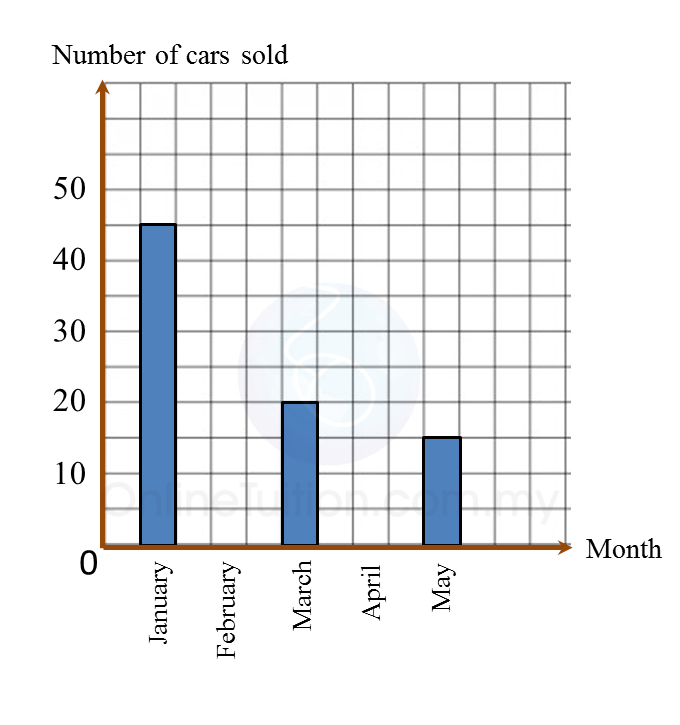 (a) The number of cars sold for the five months is 150 units. The number of cars sold in February is equal to the number of cars sold in April.
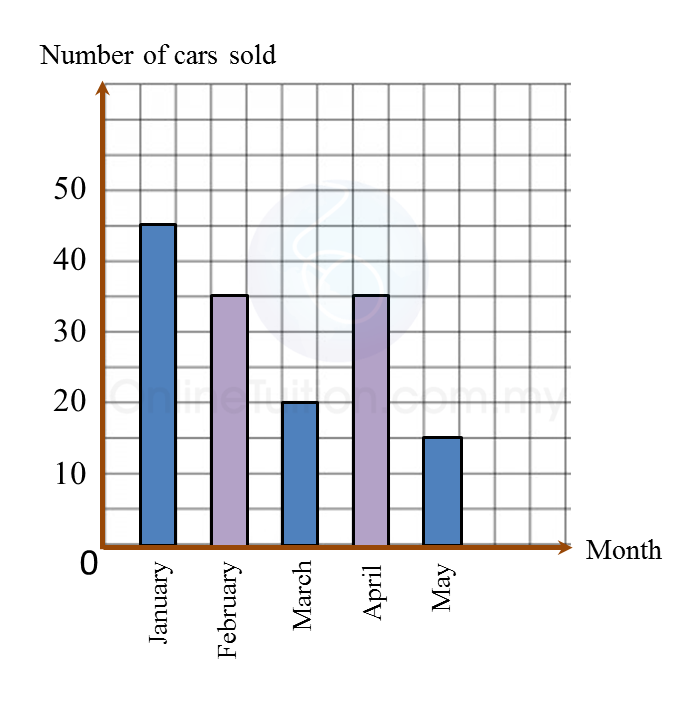 (b)
(b)


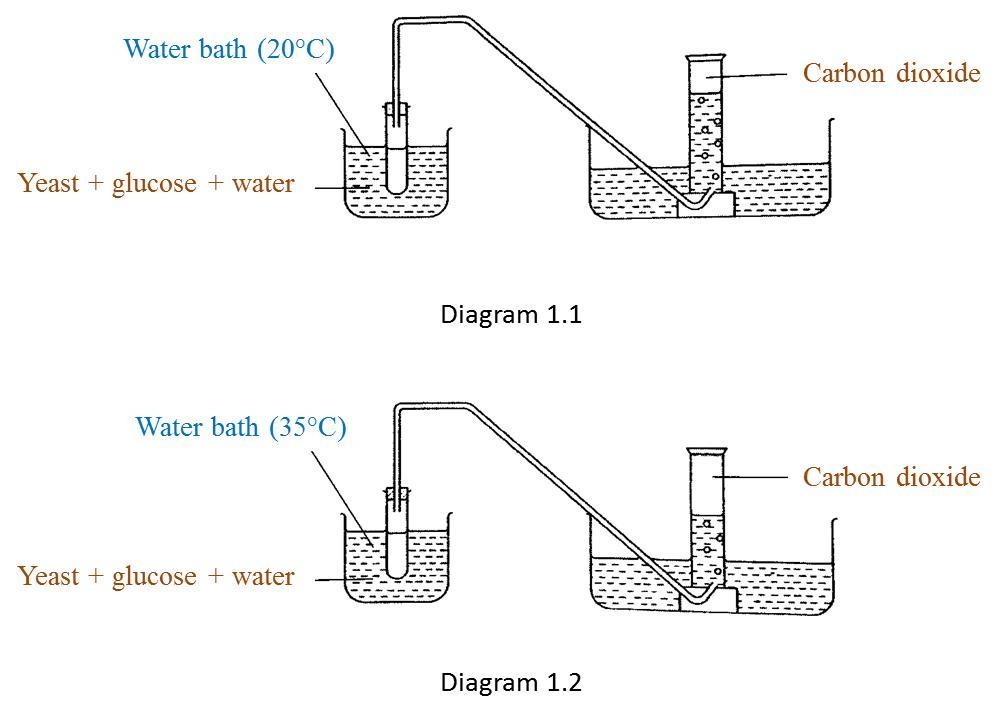
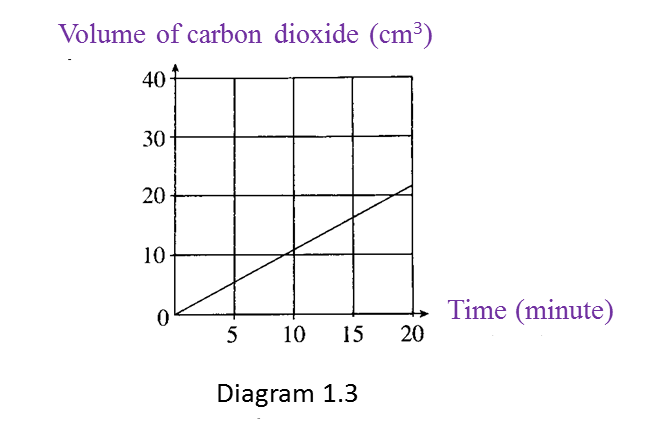 What is the relationship between the volume of carbon dioxide produced and time? [1 mark]


 (i) State two elements present in gas M. [1 mark]