7.1c Median
(A) Ungrouped Data

Example 1:
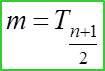
1. The median of a group of data refers to the value which is at the middle of the data after the data has been arranged according to grouped data and ungrouped data.
(A) Ungrouped Data
Example 1:
Find the median for each of the sets of data given below.
(a) 15, 18, 21, 25, 20, 18
Solution:
(a) Arrange the data in the ascending order
15, 18, 18, 20, 21, 25
Median=Tn+12=T6+12=T312=18+202=19
(b) 6, 9, 11, 13, 17
Median=Tn+12=T5+12=T3=11
(b) 13, 6, 9, 17, 11
Solution:
(a) Arrange the data in the ascending order
15, 18, 18, 20, 21, 25
Median=Tn+12=T6+12=T312=18+202=19
(b) 6, 9, 11, 13, 17
Median=Tn+12=T5+12=T3=11
(B) Grouped Data (without Class Interval)
Example 2:
Solution:
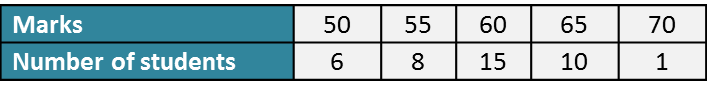
Median=Tn+12=T40+12=T2012=60←(2012th term is 60)
Example 2:
The frequency table shows the marks obtained by 40 students in a biology test.
Solution:
Median=Tn+12=T40+12=T2012=60←(2012th term is 60)
(C) Grouped Data (with Class Interval)
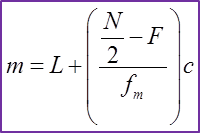
m = median
Example 3:
Find the median.
Solution:
Method 1: using formula
Step 1Median class is given by Tn2= T1002=T50∴
m = median
L = Lower boundary of median class
N = Number of data
F = Total frequency before median class
fm = Total frequency in median class
c = Class size = (Upper boundary – lower boundary)
1. The median can be determined from an accumulative frequency table and the ogive.
2. The ogive is an accumulative graph; the median, quartiles and the range between quartiles can be determined from it.
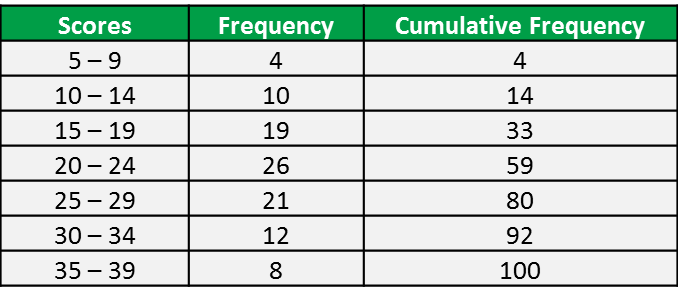
The grouped frequency distribution was obtained from 100 students regarding the scores in their test shown as below.
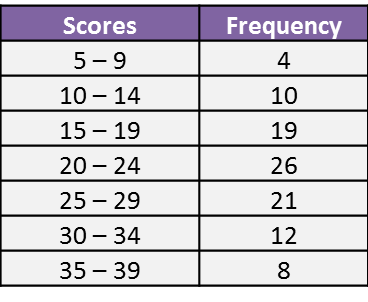
Find the median.
Method 1: using formula
Step 1Median class is given by Tn2= T1002=T50∴