Measures of Dispersion (Part 3)
7.3 Variance and Standard Deviation
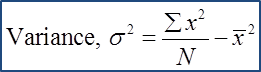
1. The variance is a measure of the mean for the square of the deviations from the mean.
7.3 Variance and Standard Deviation
1. The variance is a measure of the mean for the square of the deviations from the mean.
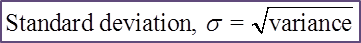
2. The standard deviation refers to the square root for the variance.
(A) Ungrouped Data
Example 1:
Solution:
Variance, σ2=∑x2N−ˉx2σ2=152+172+212+242+3125−(15+17+21+24+315)2σ2=24925−21.62σ2=31.84Standard deviation, σ = √varianceσ = √31.84σ = 5.642
Find the variance and standard deviation of the following data.
15, 17, 21, 24 and 31
Solution:
Variance, σ2=∑x2N−ˉx2σ2=152+172+212+242+3125−(15+17+21+24+315)2σ2=24925−21.62σ2=31.84Standard deviation, σ = √varianceσ = √31.84σ = 5.642
(B) Grouped Data (without Class Interval)
Example 2:
Find the variance and standard deviation of the data.
Example 2:
The data below shows the numbers of children of 30 families:
Number of child |
2 |
3 |
4 |
5 |
6 |
7 |
8 |
Frequency |
6 |
8 |
5 |
3 |
3 |
3 |
2 |
Find the variance and standard deviation of the data.
Solution:
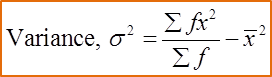
Mean ˉx=∑fx∑f=(6)(2)+(8)(3)+(5)(4)+(3)(5)+(3)(6)+(3)(7)+(2)(8)6+8+5+3+3+3+2=12630=4.2∑fx2∑f=(6)(2)2+(8)(3)2+(5)(4)2+(3)(5)2+(3)(6)2+(3)(7)2+(2)(8)26+8+5+3+3+3+2=63430=21.13Variance, σ2=∑fx2∑f−ˉx2σ2=21.133−4.22σ2=3.493Standard deviation, σ = √varianceσ = √3.493σ = 1.869
Mean ˉx=∑fx∑f=(6)(2)+(8)(3)+(5)(4)+(3)(5)+(3)(6)+(3)(7)+(2)(8)6+8+5+3+3+3+2=12630=4.2∑fx2∑f=(6)(2)2+(8)(3)2+(5)(4)2+(3)(5)2+(3)(6)2+(3)(7)2+(2)(8)26+8+5+3+3+3+2=63430=21.13Variance, σ2=∑fx2∑f−ˉx2σ2=21.133−4.22σ2=3.493Standard deviation, σ = √varianceσ = √3.493σ = 1.869
(C) Grouped Data (with Class Interval)

Example 3:
Solution:
Mean ˉx=∑fx∑fMean of daily salary=1815100=18.15Variance, σ2=∑fx2∑f−ˉx2Standard deviation, σ = √varianceσ2=37185100−18.152σ2=42.43σ = √42.43σ = 6.514
Example 3:
Daily Salary(RM) |
Number of workers |
10 – 14 |
40 |
15 – 19 |
25 |
20 – 24 |
15 |
25 – 29 |
12 |
30 – 34 |
8 |
Find the mean of daily salary and its standard deviation.
Solution:
Daily Salary (RM) |
Number of workers, f |
Midpoint, x |
fx |
fx2 |
10 – 14 |
40 |
12 |
480 |
5760 |
15 – 19 |
25 |
17 |
425 |
7225 |
20 – 24 |
15 |
22 |
330 |
7260 |
25 – 29 |
12 |
27 |
324 |
8748 |
30 – 34 |
8 |
32 |
256 |
8192 |
Total |
100 |
1815 |
37185 |