Question 10 (3 marks):
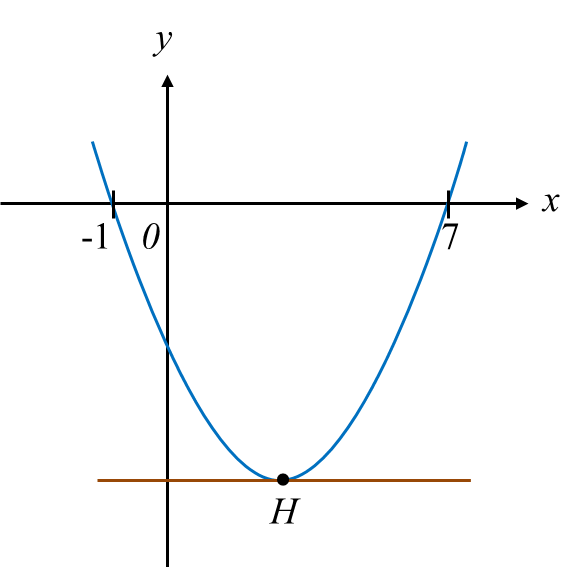
Diagram shows the graph y = a (x – p)2 + q, where a, p and q are constants. The straight line y = –8 is the tangent to the curve at point H.
 Diagram
(a) State the coordinates of H.
(b) Find the value of a.
Solution:
(a)
Coordinate x of H=−1+72=62=3Thus, coordinates of H=(3,−8).
(b)
y=a(x−p)2+qy=a(x−3)2+(−8)y=a(x−3)2−8 ......... (1)Substitute (7,0) into (1):0=a(7−3)2−80=16a−816a=8a=12
Diagram shows the graph y = a (x – p)2 + q, where a, p and q are constants. The straight line y = –8 is the tangent to the curve at point H.
 Diagram
 (a) State the coordinates of H.
(b) Find the value of a.
Solution:
(a)
Coordinate x of H=−1+72=62=3Thus, coordinates of H=(3,−8).
(b)
y=a(x−p)2+qy=a(x−3)2+(−8)y=a(x−3)2−8 ......... (1)Substitute (7,0) into (1):0=a(7−3)2−80=16a−816a=8a=12
Question 11 (3 marks):
Faizal has a rectangular plywood with a dimension 3x metre in length and 2x metre in width. He cuts part of the plywood into a square shape with sides of x metre to make a table surface.
Find the range of values of x if the remaining area of the plywood is at least (x2 + 4) metre2.
Solution:
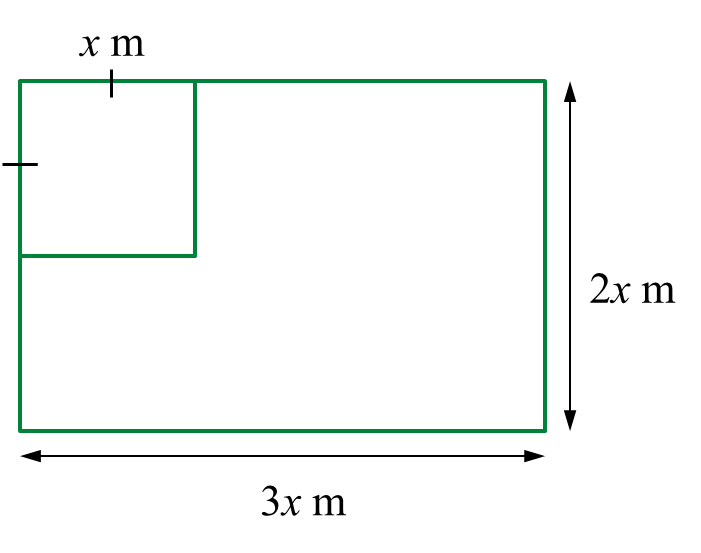
Area of plywood – area of square ≥ (x2 + 4)
3x(2x) – x2 ≥ x2 + 4
6x2 – x2 – x2 ≥ 4
4x2 ≥ 4
x2 – 1 ≥ 0
(x + 1)(x – 1) ≥ 0
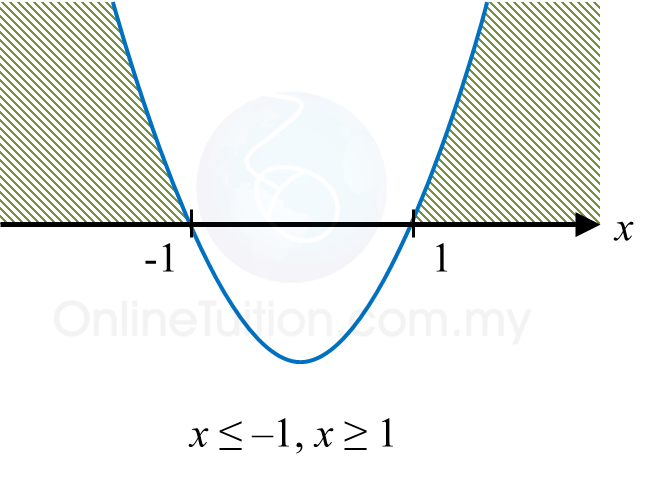
x ≤ –1 or x ≥ 1
Thus, x ≥ 1 (length is > 0)
Faizal has a rectangular plywood with a dimension 3x metre in length and 2x metre in width. He cuts part of the plywood into a square shape with sides of x metre to make a table surface.
Find the range of values of x if the remaining area of the plywood is at least (x2 + 4) metre2.
Solution:

Area of plywood – area of square ≥ (x2 + 4)
3x(2x) – x2 ≥ x2 + 4
6x2 – x2 – x2 ≥ 4
4x2 ≥ 4
x2 – 1 ≥ 0
(x + 1)(x – 1) ≥ 0
x ≤ –1 or x ≥ 1
Thus, x ≥ 1 (length is > 0)

 Diagram 9
 Diagram
 Diagram
 Diagram
 Diagram
 Table
Table  Table
Table  Table
Table Diagram