Short Questions (Question 7 & 8)


Question 7:
The masses of mangoes in a stall have a normal distribution with a mean of 200 g and a standard deviation of 30 g.
(a) Find the mass, in g, of a mango whose z-score is 0.5.
(b) If a mango is chosen at random, find the probability that the mango has a mass of at least 194 g.

Solution:
µ = 200 g
σ = 30 g
Let X be the mass of a mango.

(a)
X 200 30 = 0.5 X = 0.5 ( 30 ) + 200 X = 215 g

(b)
P ( X 194 ) = P ( Z 194 200 30 ) = P ( Z 0.2 ) = 1 P ( Z > 0.2 ) = 1 0.4207 = 0.5793


Question 8:
Diagram below shows a standard normal distribution graph.


The probability represented by the area of the shaded region is 0.3238.
(a) Find the value of k.
(b) X is a continuous random variable which is normally distributed with a mean of 80 and variance of 9.
Find the value of X when the z-score is k.

Solution:
(a)
P(Z > k) = 0.5 – 0.3238 
= 0.1762
k = 0.93

(b)
µ = 80,
σ2 = 9, σ = 3
X 80 3 = 0.93 X = 3 ( 0.93 ) + 80 X = 82.79

Short Questions (Question 5 & 6)


Question 5:
Diagram below shows the graph of a binomial distribution of X.

(a) the value of h,
(b) P (X ≥ 3)

Solution:
(a)
P (X = 0) + P (X = 1) + P (X = 2) + P (X = 3) + P (X = 4) = 1
1 16 + 1 4 + h + 1 4 + 1 16 = 1 h = 1 5 8 h = 3 8

(b)
P (X ≥ 3) = P (X = 3) + P (X = 4)
P ( X 3 ) = 1 4 + 1 16 = 5 16


Question 6:
The random variable X represents a binomial distribution with 10 trails and the probability of success is ¼.
(a) the standard deviation of the distribution,
(b) the probability that at least one trial is success.

Solution:
(a)
n = 10, p = ¼
Standard deviation = n p q = 10 × 1 4 × 3 4 = 1.875

(b)
P ( X = r ) = C 10 r ( 1 4 ) r ( 3 4 ) 10 r P ( X 1 ) = 1 P ( X < 1 ) = 1 P ( X = 0 ) = 1 C 10 0 ( 1 4 ) 0 ( 3 4 ) 10 = 0.9437

8.2b Standard Normal Distribution Tables (Example 2)


8.2b Standard Normal Distribution Tables (Example 2)

Example 2:
Find the value of each of the following probabilities by reading the standard normal distribution tables.
(a) P (0.4 < Z < 1.2)
(b) P (–1 < Z < 2.5)
(c) P (–1.3 < Z < –0.5)

Solution:
(a)
P (0.4 < Z < 1.2)
= Area P – Area Q
= Q (0.4) – Q (1.2) ← (reading from the standard normal distribution table for 0.4 and 1.2 are 0.3446 and 0.1151 respectively)
= 0.3446 – 0.1151
= 0.2295


(b)
P (–1 < Z < 2.5)
= 1– Area P – Area Q
= 1 – Q (1) – Q (2.5)
= 1 – 0.1587 – 0.00621 ← (reading from the standard normal distribution table for 1 and 2.5 are 0.1587 and 0.00621 respectively)
= 0.8351


(c)
P (–1.3 < Z < –0.5)
= Area P – Area Q
= Q (0.5) – Q (1.3)
= 0.3085 – 0.0968 ← (reading from the standard normal distribution table for 0.5 and 1.3 are 0.3085 and 0.0968 respectively)
= 0.2117


8.2c Probability of an Event


8.2c Probability of an Event

Example:
The masses of pears in a fruit stall are normally distributed with a mean of 220 g and a variance of 100 g. Find the probability that a pear that is picked at random has a mass
(a) of more than 230 g.
(b) between 210 g and 225 g.
Hence, find the value of h such that 90% of the pears weigh more than h g.

Solution:
µ = 220 g
σ = √100 = 10 g
Let X be the mass of a pear.

(a)
P( X>230 ) =P( Z> 230220 10 ) Convert to standard normal  distribution using Z= Xμ σ =P( Z>1 ) =0.1587


(b)
P( 210<X<225 ) =P( 210220 10 <Z< 225220 10 ) Convert to standard normal  distribution using Z= Xμ σ =P( 1<Z<0.5 ) =1P( Z>1 )P( Z>0.5 ) =10.15870.3085 =0.5328

For 90% (probability = 0.9) of the pears weigh more than h g, 
(X > h) = 0.9
(X < h) = 1 – 0.9
= 0.1

From the standard normal distribution table,
(Z > 0.4602) = 0.1
(Z < –0.4602) = 0.1
h220 10 =0.4602 h220=4.602 h=215.4


8.2b Standard Normal Distribution Tables (Example 3)


8.2b Standard Normal Distribution Tables (Example 3)

Example 3:
Find the value of k if
(a) (Z > k) = 0.0480
(b) (Z > k) = 0.8350

Solution:
(a)


From the standard normal distribution table, k = 1.665

Z
6
5 (Subtract)
1.6
.0485
5

(b)

 
From the standard normal distribution table,
k –0.974 ← (Remember to put a negative sign at the value of k because it is on the left-hand side of the normal curve.)

Z
7
4 (Subtract)
0.9
.1660
10

8.2b Standard Normal Distribution Tables (Example 1)


8.2b Standard Normal Distribution Tables (Example 1)

Example 1:
Find the value of each of the following probabilities by reading the standard normal distribution tables.
(a) (Z > 0.600)
(b) (Z < –1.24)
(c) (Z > –1.1)
(d) (Z < 0.76)
 
Solution:
Standard Normal Distribution Table


*When reading the standard normal distribution tables, it involves subtraction of values.

(a)
From the standard normal distribution table,(Z > 0.600) = 0.2743


(b)
(Z < –1.24)
= (Z > 1.24)
= (1.24)
= 0.1075 ← (reading from the standard normal distribution table)


(*In the standard normal distribution table, all the values of are positive. As the curve is symmetrical about the vertical axis, the area of the shaded region in both of the graphs are the same.)


(c)
(Z > –1.1)
= 1 – Area P
= 1 – (–1.1)
= 1 – 0.1357 ← (reading from the standard normal distribution table)
= 0.8643

(d)
(Z < 0.76)
= 1 – Area P
= 1 – (0.76)
= 1 – 0.2236 ← (reading from the standard normal distribution table)
= 0.7764


Short Questions (Question 3 & 4)


Question 3 (4 marks):
Diagram shows a standard normal distribution graph.
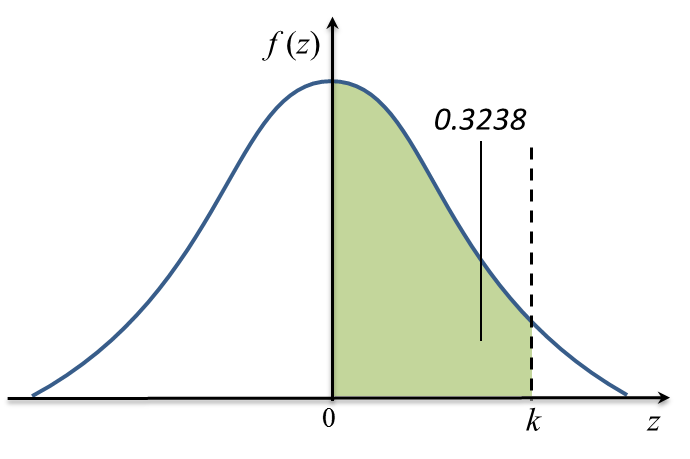
Diagram

The probability represented by the area of the shaded region is 0.2881.
(a) Find the value of h.
(b) X is a continuous random variable which is normally distributed with a mean, μ and a variance of 16.
Find the value of μ if the z-score of X = 58.8 is h.


Solution:
(a)
P(X < h) = 0.5 – 0.2881
P(X < h) = 0.2119
P(X < –0.8) = 0.2119
h = –0.8

(b)

X=58.8 Xμ σ = 58.8μ σ    Z= 58.8μ 4    h= 58.8μ 4 0.8= 58.8μ 4 3.2=58.8μ μ=58.8+3.2 μ=62


Question 4 (4 marks):
A voluntary body organizes a first aid course 4 times per month, every Saturday from March until September.
[Assume there are four Saturdays in every month]

Salmah intends to join the course but she might need to spare a Saturday per month to accompany her mother to the hospital. The probability that Salmah will attend the course each Saturday is 0.8. Salmah will be given a certificate of monthly attendance if she can attend the course at least 3 times a month.

(a)
Find the probability that Salmah will be given the certificate of monthly attendance.

(b)
Salmah will qualify to sit for the first aid test if she obtains more than 5 certificates of monthly attendance.
Find the probability that Salmah qualifies to take the first aid test.


Solution:
(a)

P( X=r )= C n r p r q nr p=0.8, q=0.2, n=4, r=3, 4 P( X3 ) =P( X=3 )+P( X=4 ) = C 4 3 ( 0.8 ) 3 ( 0.2 ) 1 + C 4 4 ( 0.8 ) 4 ( 0.2 ) 0 =0.4096+0.4096 =0.8192

(b)

P( X=r )= C n r p r q nr p=0.8192, q=0.1808, n=7, r=6, 7 P( X>5 ) =P( X=6 )+P( X=7 ) = C 7 6 ( 0.8192 ) 6 ( 0.1808 ) 1 + C 7 7 ( 0.8192 ) 7 ( 0.1808 ) 0 =0.3825+0.2476 =0.6301

Short Questions (Question 1 & 2)


Question 1 (2 marks):
Diagram shows a probability distribution graph for a random variable X, X ~ N(μ, σ2).

Diagram

It is given that AB is the axis of symmetry of the graph.
(a) State the value of μ.
(b) If the area of the shaded region is 0.38, state the value of P(5 ≤ X ≤ 15).

Solution:
(a)
μ = 0

(b)
P(10 ≤ X ≤ 15)
= 0.5 – 0.38
= 0.12

P(5 ≤ X ≤ 10)
= P(10 ≤ X ≤ 15)
= 0.12

Thus P(5 ≤ X ≤ 15)
= 0.12 + 0.12
= 0.24


Question 2 (3 marks):
Diagram shows the graph of binomial distribution X ~ B(3, p).

Diagram

(a)
Express P(X = 0) + P(X > 2) in terms of a and b.
(b) Find the value of p.


Solution:
(a)
P(X = 0) + P(X = 1) + P(X = 2) + P(X = 3) = 1
P(X = 0) + a + b + P(X = 3) = 1
P(X = 0) + P(X = 3) = 1 – a – b
P(X = 0) + P(X > 2) = 1 – a – b

(b)

P( X=0 )= 27 343 3 C 0 ( p 0 ) ( 1p ) 3 = 27 343 1×1× ( 1p ) 3 = ( 3 7 ) 3 1p= 3 7 p= 4 7

Long Questions (Question 12)


Question 12 (10 marks):
(a) The mass of honeydews produced in a plantation is normally distributed with a mean of 0.8 kg and a standard deviation of 0.25 kg. The honeydews are being classified into three grades A, B and C according to their masses:

Grade A > Grade B > Grade
C

(i)
The minimum mass of a grade A honeydew is 1.2 kg.
If a honeydew is picked at random from the plantation, find the probability that the honeydew is of grade A.

(ii)
Find the minimum mass, in kg, of grade B honeydew if 20% of the honeydews are of grade C.

(b)
At the Shoot the Duck game booth at an amusement park, the probability of winning is 25%.
Jacky bought tickets to play n games. The probability for Jacky to win once is 10 times the probability of losing all games.

(i)
Find the value of n.

(ii)
Calculate the standard deviation of the number of wins.

Solution:
μ = 0.8 kg, σ = 0.25 kg

(a)(i)

P( grade A )=P( X>1.2 )   =P( Z> 1.20.8 0.25 )   =P( Z>1.6 )   =0.0548

(a)(ii)
P( grade C )=0.2 P( X<m )=0.2 P( Z< m0.8 0.25 )=0.2 P( Z<0.842 )=0.2     m0.8 0.25 =0.842 m0.8=0.2105 m=0.5895 Minimum mass of grade B honeydew is the same as the maximum mass of grade C honeydew. Minimum mass of grade B=0.5895 kg


(b)
p=0.25, X=B( n, 0.25 ) P( X=r )= C n r p r q nr    = C n r ( 0.25 ) r ( 0.75 ) nr

(b)(i)
P( X=1 )=10 P( X=0 ) C n r ( 0.25 ) 1 ( 0.75 ) nr =10× C n 0 ( 0.25 ) 0 ( 0.75 ) n n×0.25× ( 0.75 ) nr =10×1×1× ( 0.75 ) n 0.25n× ( 0.75 ) n1 0.75 n =10 0.25n× 0.75 1 =10 1 4 n( 4 3 )=10 1 3 n=10 n=30

(b)(ii)
n=30, p=0.25 Standard deviation = np( 1p ) = 30×0.25×0.75 =2.372

Long Questions (Question 11)


Question 11 (10 marks):
A study shows that the credit card balance of the customers is normally distributed as shown in Diagram 6.

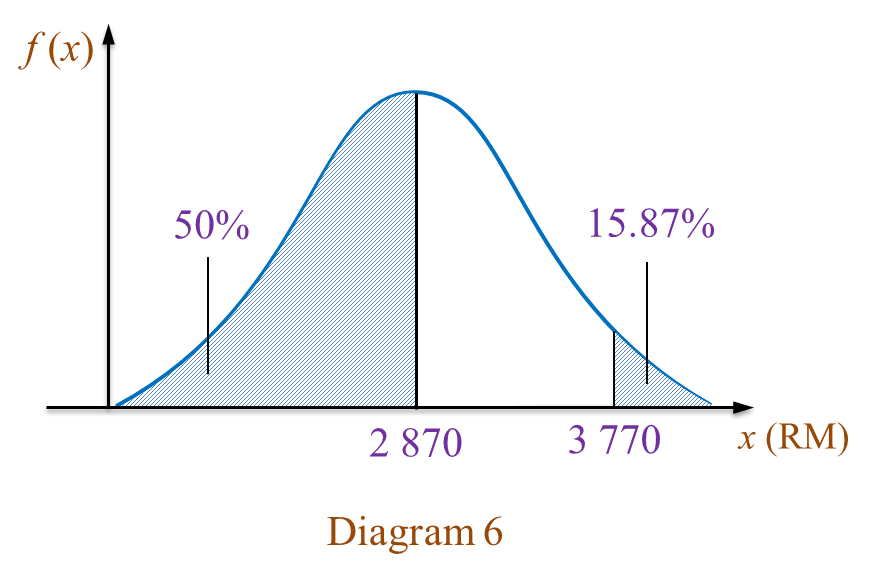
(a)(i) Find the standard deviation.
(ii) If 30 customers are chosen at random, find the number of customers who have a credit card balance between RM1800 and RM3000.

(b) It is found that 25% of the customers have a credit card balance less than RM y.
Find the value of y.

Solution:
(a)(i)
μ=2870,x=3770 P( X>3770 )=15.87% P( Z> 37702870 σ )=0.1587 P( Z>1.0 )=0.1587 37702870 σ =1.0 σ=900


(a)(ii)
P( 1800<X<3000 ) =P( 18002870 900 <Z< 30002870 900 ) =P( 1.189<Z<0.144 ) =1P( Z1.189 )P( Z0.144 ) =10.11720.4427 =0.4401 Number of customers=0.4401×30   =14


(b)
μ=2870,x=y P( x<y )=25% P( Z< y2870 900 )=0.25 y2870 900 =0.674 y=2263.40