Simultaneous Equations (Example 1 & 2)


Example 1:
Solve the simultaneous equations.
x+14y=1 and y28=4x.

Solution:
x+14y=1(1)y28=4x(2)x=114y(3)

Substitute (3) into (2),
y28=4(114y)y28=444y
y2 + y – 12 = 0
(y + 4)(y – 3) = 0
y = –4 or y = 3 

Substitute the values of y into (3),
when y=4, x=114(4)=2when y=3, x=114(3)=14The solutions are x=2, y=4 and x=14, y=3


Example 2:
Solve the simultaneous equations 2x + y = 1 and 2x2+ y2 + xy = 5.
Correct your answer to three decimal places.

Solution:
2x + y = 1-----(1)
2x2 + y2+ xy = 5-----(2)

From (1),
y = 1 – 2x-----(3)

Substitute (3) into (2).
2x2 + (1 – 2x)2 + x(1 – 2x) = 5
2x2 + (1 – 2x)(1 – 2x) + x – 2x2 = 5
1 – 2x – 2+ 4x2 + x – 5 = 0
4x2 – 3x – 4 = 0

From x=b±b24ac2aa=4, b=3c=4x=(3)±(3)24(4)(4)2(4)x=3±738x=0.693 or 1.443

Substitute the values of x into (3).
When x = –0.693,
y = 1 – 2 (–0.693) = 2.386 (correct to 3 decimal places)

When x = 1.443,
y = 1 – 2 (1.443) = –1.886 (correct to 3 decimal places)

The solutions are x = –0.693, y  = 2.386 and x = 1.443, y = –1.886.
Quadratic Functions, SPM Practice (Long Questions)


Question 5:


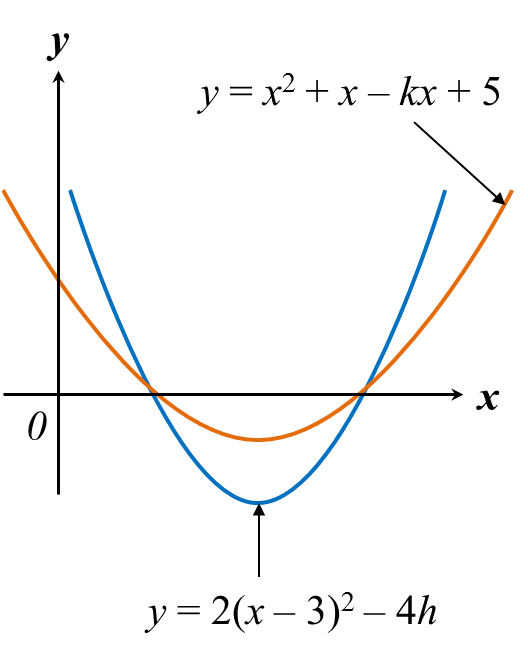
Diagram above shows the graphs of the curves y = x2 + xkx + 5 and y = 2(x – 3) – 4h that intersect the x-axis at two points. Find
(a) the value of k and of h,
(b) the minimum value of each curve.


Solution:
(a)
y=x2+xkx+5=x2+(1k)x+5=[x+(1k)2]2(1k2)2+5axis of symmetry of the graph isx=(1k)2

y=2(x3)24haxis of symmetry of the graph is x=3. 1k2=31+k=6k=7

Substitute k=7 into equationy=x2+x7x+5  =x26x+5At x-axis,y=0;x26x+5=0(x1)(x5)=0x=1,5

At point (1,0)Substitute x=1,y=0 into the graph:y=2(x3)24h0=2(13)24h4h=2(4)4h=8h=2

(b)
For y=x26x+5=(x3)29+5=(x3)24 Minimum value is 4.For y=2(x3)28, minimum value is8.

Quadratic Functions, SPM Practice (Long Questions)


3.9.1 Quadratic Functions, SPM Practice (Long Questions)

Question 1:
Without drawing graph or using method of differentiation, find the maximum or minimum value of the function y = 2 + 4x – 3x2. Hence, find the equation of the axis of symmetry of the graph.

Solution:
By completing the square for the function in the form of y = a(x + p)2+ q to find the maximum or minimum value of the function.

y = 2 + 4x – 3x2
y = – 3x2 + 4x + 2 ← (in general form)
y=3[x243x23]y=3[x243x+(43×12)2(43×12)223]y=3[(x23)2(23)223]  

y=3[(x23)24969]y=3[(x23)2109]y=3(x23)2+103in the form of a(x+p)2+q

Since a = –3 < 0,
Therefore, the function has a maximum value of 103.
x23=0x=23
Equation of the axis of symmetry of the graph is x=23.   


Question 2:

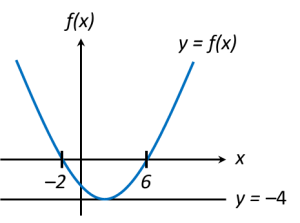
The diagram above shows the graph of a quadratic function y = f(x). The straight line y = –4 is  tangent to the curve y = f(x).
(a) Write the equation of the axis of symmetry of the function f(x).
(b)   Express f(x) in the form of (x + p)2 + q , where p and q are constant.
(c) Find the range of values of x so that
(i) f(x) < 0, (ii) f(x) ≥ 0.

Solution:
(a)
x-coordinate of the minimum point is the midpoint of (–2, 0) and (6, 0)
= =2+62=2  
Therefore, equation of the axis of symmetry of the function f(x) is x = 2.


(b)
Substitute x = 2 into x + p = 0,
2 + p = 0
p = –2
and q = –4 (the smallest value of f(x))
Therefore, f(x) = (x + p)2 + q
f(x) = (x – 2)2 – 4

(c)(i) From the graph, for f(x) < 0, range of values of x are –2 < x < 6 ← (below x-axis).

(c)(ii) From the graph, for f(x) ≥ 0, range of values of x are x ≤ –2 or x ≥ 6 ← (above x-axis).


Quadratic Functions, SPM Practice (Short Questions)


Question 5:
Find the range of values of k if the quadratic equation 3(x2kx – 1) = kk2 has two real and distinc roots.

Solution:
3(x2kx1)=kk23x23kx3k+k2=03x23kx+k2k3=0a=3,b=3k,c=k2k3In cases of two real and distinc roots,b24ac>0 is applied.(3k)24(3)(k2k3)>09k212k2+12k+36>03k2+12k+36>0k2+4k+12>0k24k12<0(k+2)(k6)<0k=2,6


The range of values of k is 2<k<6.


Question 6:
Given that the quadratic equation hx2 – (h + 2)x – (h – 4) = 0 has real and distinc roots.  Find the range of values of h.

Solution:
The quadratic equation hx2(h+2)x(h4)=0has real and distinc roots.b24ac>0 is applied.(h2)24(h)(h+4)>0h2+4h+4+4h216h>05h212h+4>0(5h2)(h2)>0The coefficient of h2 is positive, the region above the x-axis should be shaded.(5h2)(h2)=0h=25,2


The range of values of h for (5h2)(h2)>0 ish<25 or h>2.

3.5b Nature of the Roots (Combination of Straight Line and a Curve)

Example 2 (Combination of Straight Line and a Curve)
The straight line y=2k+1   intersects the curve y=x+k2x   at two distinct points.  Find the range of values of k.


Example 3 (Straight Line does not intersect the curve)
Find the range of values of m for which the straight line y=mx+6   does not meet the curve 2x2xy=3  .


3.5a Nature of the Roots (Combination of Straight Line and a Curve)

Example 1
Find the value of p for which 8y=x+2p   is a tangent to the curve 2y2=x+p  .


3.5 Nature of the Roots (Combination of Straight Line and a Curve)

Nature of the Roots (Combination of Straight Line and the Curve)
When you have a straight line and a curve, you can solve the equation of the straight line and the curve simultaneously and form a quadratic equation, ax2 +bx + c = 0. The discriminant, b24ac  gives information about the number of points of intersection.


3.4 Quadratic Inequalities (Part 1)

Solving Quadratic Inequality

  1. The solution of the quadratic inequalities are the ranges of values which satisfied the inequalities itself. 
  2. There are 2 methods to solve the inequalities. 
    1. Graph method
    2. Number line method


Step to solve a Quadratic Inequalities
Step 1 : Rewrite the inequality with zero on one side and make sure a > 0
Step 2 : Find where it crosses the x-axis  (Put y = 0)
Step 3 : Sketch the graph and shade the region to find the range of values of  x


Example 
Find the range of values of x for each of the following :
(a) x24x+3<0
(b) 12+10x2x2<0


Revision - Linear Inequality


Solving Quadratic Inequality - Graph Method


Solving Quadratic Inequality - Number Line Method

Suggested Video

Solving Quadratic Inequalities - The Basics

3.3c Sketching the Graph of Quadratic Functions (Example)

Example 1
Express y=5+4xx2   in the form y=a(x+b)2   , where a, b, and c  are constants. Hence state the maximum  value of y and the value of x at which it occurs. Sketch the curve y=5+4xx2   .


3.3b Sketching the Graph of Quadratic Functions

Graphing Quadratic Function

If you are asked to sketch the graph of a quadratic function, you need to show
a. the shape of the graph
b. the maximum/minimum point of the graph
c. the x-intercept of the graph
d. the y-intercept of the graph


Example
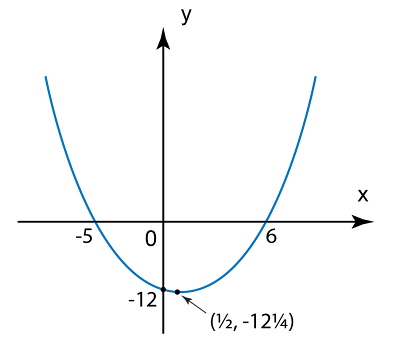
Sketch the curve of the quadratic function f(x)=x2x12

Answer:
The shape of the graph
Since the coefficient of x2 is positive, hence the graph is a U shape parabola with a minimum point.

The minimum point of the graph
By completing the square
f(x)=x2x12f(x)=x2x+(12)2(12)212f(x)=(x12)21412f(x)=(x12)21214Minimum point = (12,1214)

For y-intercept, x = 0
f(0)=(0)2(0)12=12

For x-intercept, f(x) = 0
f(x)=x2x120=x2x12(x+5)(x6)=0x=5 or x=6


Suggested Video

Graphs of Quadratic Function - khanacademy

Algebra - Quadratic Functions (Parabolas) - yaymath