Question 1 (2 marks):
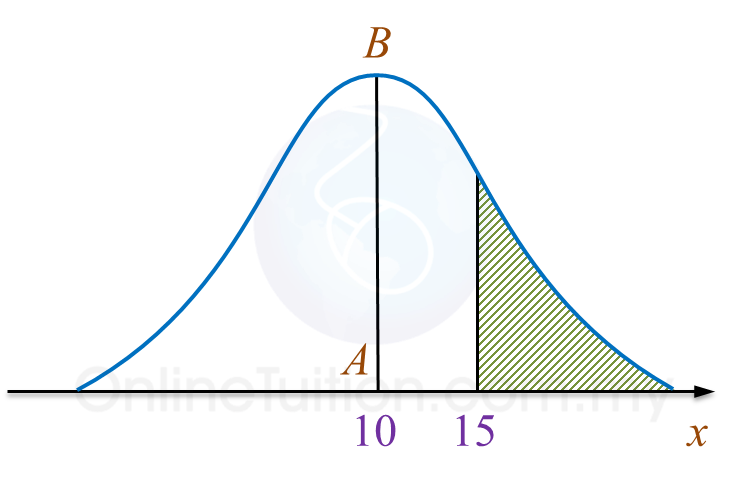
Diagram shows a probability distribution graph for a random variable X, X ~ N(μ, σ2).
 Diagram
It is given that AB is the axis of symmetry of the graph.
(a) State the value of μ.
(b) If the area of the shaded region is 0.38, state the value of P(5 ≤ X ≤ 15).
Solution:
(a)
μ = 0
(b)
P(10 ≤ X ≤ 15)
= 0.5 – 0.38
= 0.12
P(5 ≤ X ≤ 10)
= P(10 ≤ X ≤ 15)
= 0.12
Thus P(5 ≤ X ≤ 15)
= 0.12 + 0.12
= 0.24
Diagram shows a probability distribution graph for a random variable X, X ~ N(μ, σ2).
Diagram It is given that AB is the axis of symmetry of the graph.
(a) State the value of μ.
(b) If the area of the shaded region is 0.38, state the value of P(5 ≤ X ≤ 15).
Solution:
(a)
μ = 0
(b)
P(10 ≤ X ≤ 15)
= 0.5 – 0.38
= 0.12
P(5 ≤ X ≤ 10)
= P(10 ≤ X ≤ 15)
= 0.12
Thus P(5 ≤ X ≤ 15)
= 0.12 + 0.12
= 0.24
Question 2 (3 marks):
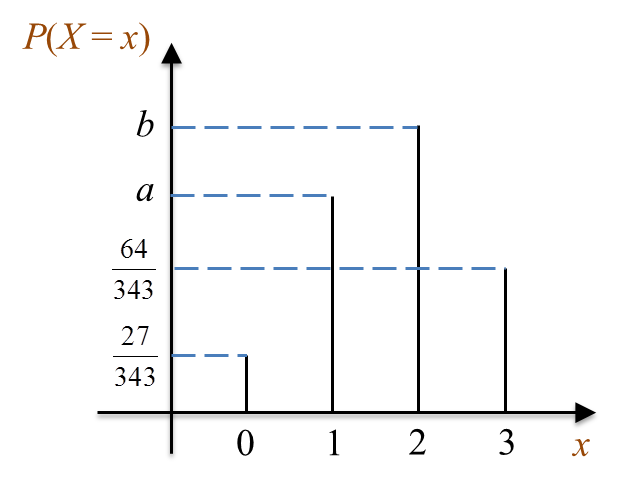
Diagram shows the graph of binomial distribution X ~ B(3, p).
 Diagram
(a) Express P(X = 0) + P(X > 2) in terms of a and b.
(b) Find the value of p.
Solution:
(a)
P(X = 0) + P(X = 1) + P(X = 2) + P(X = 3) = 1
P(X = 0) + a + b + P(X = 3) = 1
P(X = 0) + P(X = 3) = 1 – a – b
P(X = 0) + P(X > 2) = 1 – a – b
(b)
Diagram shows the graph of binomial distribution X ~ B(3, p).
Diagram (a) Express P(X = 0) + P(X > 2) in terms of a and b.
(b) Find the value of p.
Solution:
(a)
P(X = 0) + P(X = 1) + P(X = 2) + P(X = 3) = 1
P(X = 0) + a + b + P(X = 3) = 1
P(X = 0) + P(X = 3) = 1 – a – b
P(X = 0) + P(X > 2) = 1 – a – b
(b)