Question 5:
Solution:
(a) Modal class = time 50 – 54 seconds (highest frequency).
(b)
(c)
(d)
The table below shows the frequency distribution of the time spent by 50 swimmers in the pool in a swimming practice.
Time (seconds) |
Frequency |
35 – 39 |
5 |
40 – 44 |
8 |
45 – 49 |
9 |
50 – 54 |
15 |
55 – 59 |
11 |
60 – 64 |
2 |
(a) State the modal class.
(b) Calculate the estimated mean of the time spent of a swimmer.
(c) Based on table above, complete table below in the answer space by writing down the values of the upper boundary and the cumulative frequency.
Upper Boundary |
Cumulative Frequency |
34.5 |
0 |
39.5 |
|
64.5 |
50 |
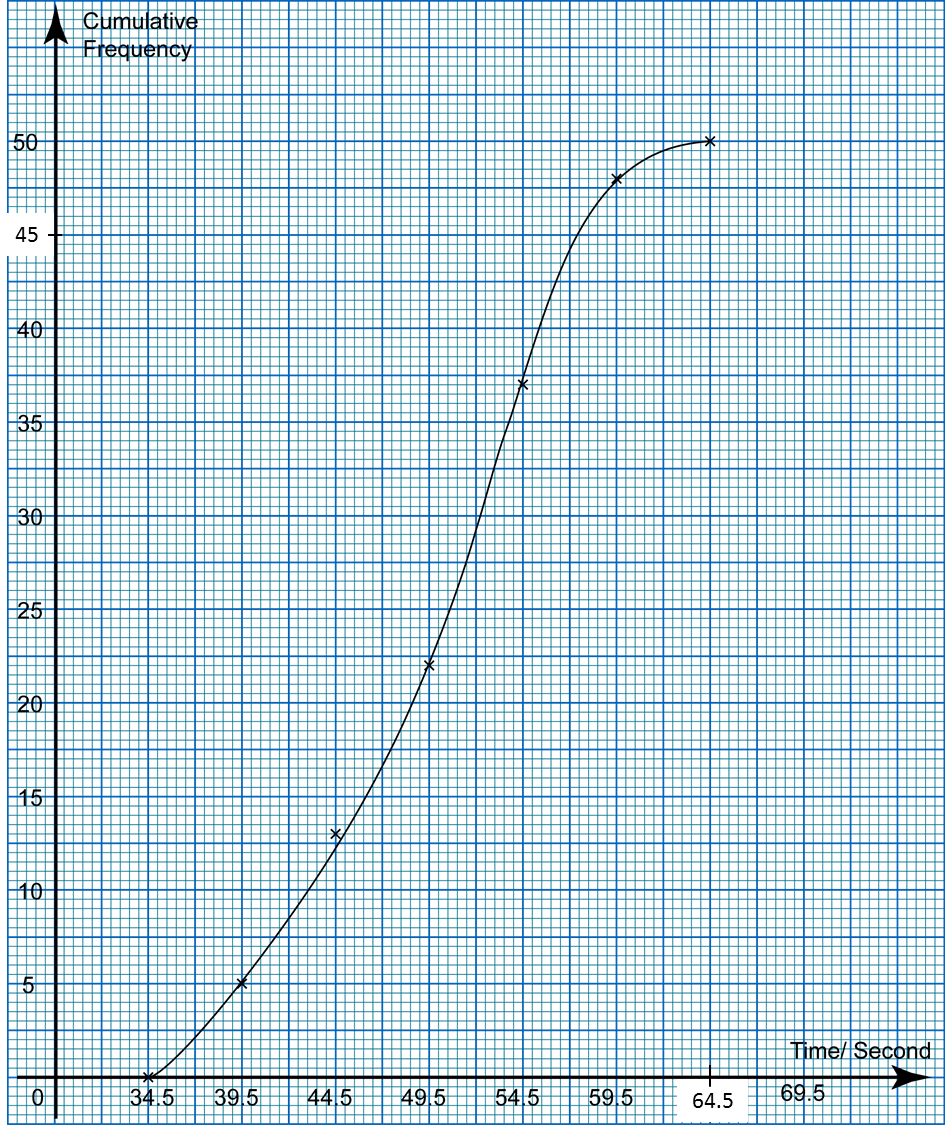
(d) For this part of the question, use graph paper. You may use a flexible curve rule.
By using a scale of 2 cm to 5 seconds on the horizontal axis and 2 cm to 5 swimmers on the vertical axis, draw an ogive for the data.
Solution:
(a) Modal class = time 50 – 54 seconds (highest frequency).
(b)
(c)
Upper Boundary |
Cumulative Frequency |
34.5 |
0 |
39.5 |
5 |
44.5 |
13 |
49.5 |
22 |
54.5 |
37 |
59.5 |
48 |
64.5 |
50 |
(d)