6.1 Quantity Represented by the Gradient of a Graph (Part 2)


(B) Speed – Time Graph
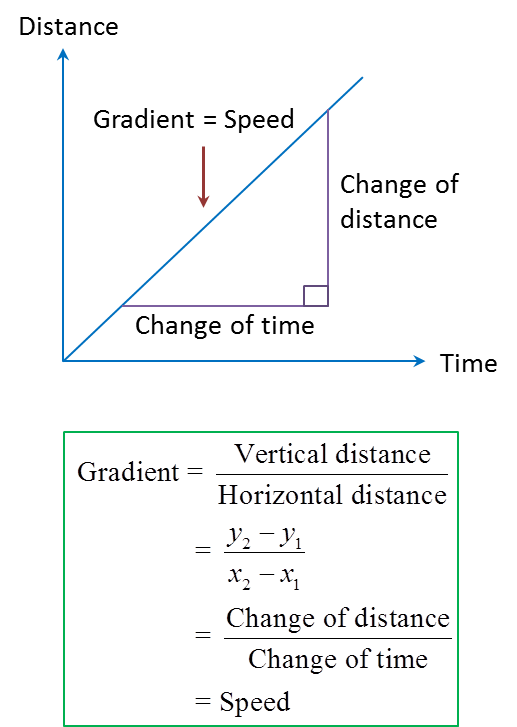
1. The gradient of a speed-time graph is the rate of change of speed or acceleration.
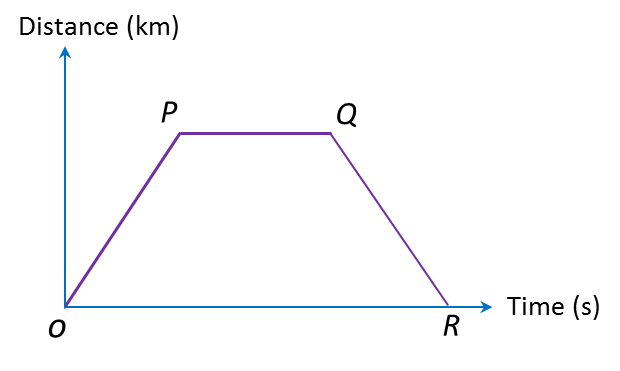


2.


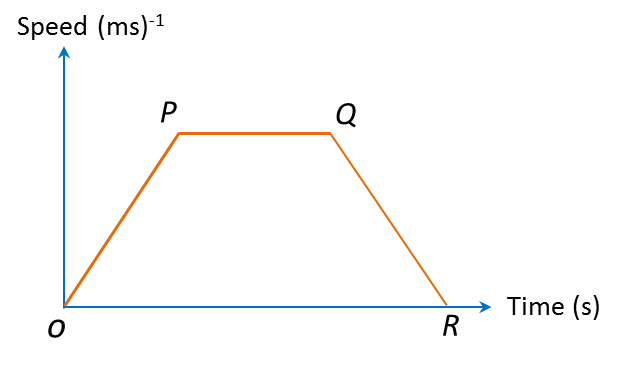
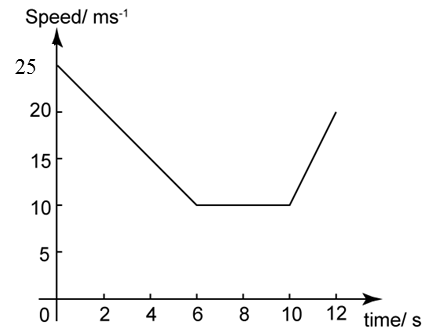
(a) From O to P: Gradient = positive → (Speed of object increasing or accelerating).

(b) 
From P to Q: Gradient = 0 → (Object is moving at uniform speed).

(c) 
From Q to R: Gradient = negative → (Speed of object decreasing or decelerating).


Example:


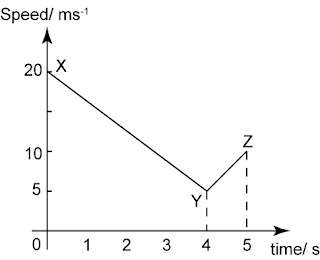
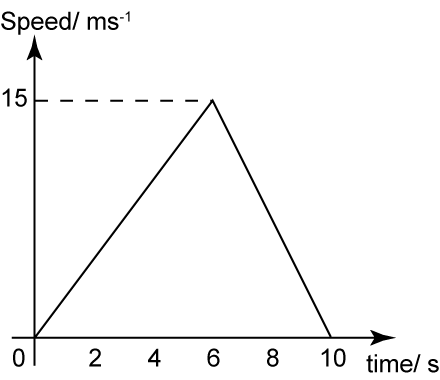
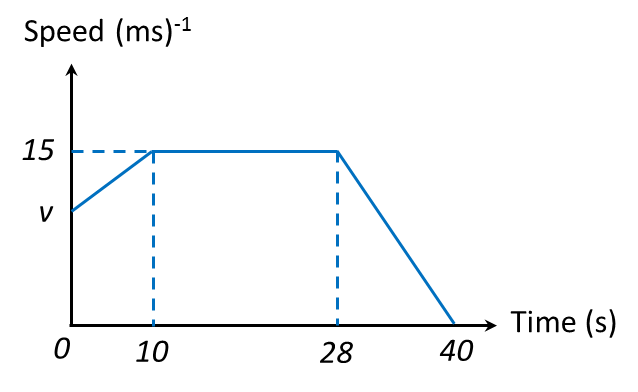
The diagram above shows the speed-time graph of a moving car for 5 seconds. Find
(a) the rate of speed change when the car travel from X to Y.
(b) the rate of speed change when the car travel from Y to Z.
 
Solution:
(a)
Rate of speed change when the car travels from X to Y
= Gradient
= y 2 y 1 x 2 x 1 = 5 20 4 0 = 15 4 ms 2 Negative gradient indicates that the speed is decreasing .

(b)
Rate of speed change when the car travels from Y to Z
= Gradient
= y 2 y 1 x 2 x 1 = 10 5 5 4 = 5 ms 2

6.3 SPM Practice (Long Questions)


Question 1:


The diagram above shows the distance-time graph of a moving particle for 5 seconds. Find
(a) the distance travel by the particle from the time 2 second to 5 second.
(b)   the speed of the particle for the first 2 seconds.

Solution:

(a)
Distance travel by the particle from the time 2 second to 5 second
= 20 – 15
= 5 m

(b)
The speed of the particle for the first 2 seconds
= Gradient 
= 15 0 2 0 = 7.5 ms 1


Question 2:


The diagram above shows the distance-time graph of a moving car for 12 seconds. Find
(a)    the value of v, if the average speed of the car for the first 6 seconds is 2 ms-1.
(b)   average speed of the car for the first 8 seconds.

Solution:

(a)
Average speed of the car for the first 6 seconds is 2 ms -1 Total distance travelled Total time taken =2 v 6 =2 v=12

(b)
Average speed of the car for the first 8 seconds = 15 8 =1.875 m s 1


6.3 SPM Practice (Long Questions)


Question 3:
Diagram below shows the distance-time graph for the journey of a train from one town to another for a period of 90 minutes.


(a) State the duration of time, in minutes, during which the train is stationery.
(b) Calculate the speed, in km h-1, of the train in the first 40 minutes.
(c) Find the distance, in km, travelled by the train for the last 25 minutes.

Solution:
(a) Duration the train is stationery = 65 – 40 = 25 minutes

(b) Speed of the train in the first 40 minutes = 15090 km 40 minutes = 60 km 40 60  h =90 km / h

(c) 90 – 0 = 90 km


Question 4:


The diagram above shows the speed-time graph of a moving particle for 10 seconds. From the graph above, find
(a) the total distance travel by the particle for the whole journey.
(b)   the average speed for the whole journey.
 
Solution:
(a)
Total distance travelled
= Area under the speed-time graph
= Area of triangle
= ½ × 15 × 10
= 75 m

(b)
Average speed for the whole journey
= Total distance travelled Total time taken = 75 10 = 7.5 m s 1

6.3 SPM Practice (Long Questions)


Question 5:


The diagram above shows the speed-time graph of a moving particle for 12 seconds. Find
(a) the length of the time, in s that the particle move with uniform speed.
(b)   the distance travel by the particle when it move with constant speed.
(c)  the distance travel by the particle when the rate of the speed change is negative.

Solution:

(a)
Length of the time the particle move with uniform speed
= 10 – 6
= 4 s

(b)

Distance travel by the particle when it move with constant speed
= Area under the speed-time graph
= Area of rectangle
= 4 × 10
= 40 m

(c)
Distance travel by the particle when the rate of the speed change is negative
= Area under the speed-time graph for the first 6 s
= Area of trapezium
= ½ (10 + 25)(6)
= 105 m


Question 6:
Diagram below shows the speed-time graph for the movement of an object for a period of 40 seconds.


(a) State the duration of time, in s, for which the object moves with uniform speed.
(b) Calculate the rate of change of speed, in ms-2, of the object for the last 12 seconds.
(c) Calculate the value of v, if the total distance travelled for the period of 40 seconds is 500 m.

Solution:
(a) Duration of time the object moves with uniform speed = 28s – 10s = 18s

(b) Rate of change of speed = 15 12 ms 2 =1.25  ms 2 (c) Area of trapezium I + Area of trapezium II=500 1 2 ( v+15 )10+ 1 2 ( 18+30 )15=500    5v+75+360=500 5v=65   v=13

6.1 Quantity Represented by the Gradient of a Graph (Part 1)


6.1 Quantity Represented by the Gradient of a Graph
The gradient of graph is the rate of change of a quantity on the vertical axis with respect to the change of another quantity on the horizontal axis.
 
(A) Distance – Time Graph
1. The gradient of a distance-time graph is speed.


2. 


(a) From O to P: Gradient = positive
(b) From P to Q: Gradient = 0 → (The object stopped moving)
(c) From Q to R: Gradient = negative → (The object is travelling in an opposite direction from the original direction).


3.


Example 1:


The diagram above shows a graph of distance-time for the motion of a car. Find the speed of the car for the first 6 second.

Solution:
The speed of the car for the first 6 seconds
= Gradient 
= 12 0 6 0 = 2.0 ms 1

5.1 Direct Variation (Sample Questions)


Example:
Given that p varies directly as square root of q and p = 12 when = 36, find
(a) The value of p when = 16
(b) The value of q when = 18

Solution:

p q , p = k q 12 = k 36
12 = k(6)
k = 2
p = 2 q

(a)
p = 2 q p = 2 16
p = 8

(b)   
p = 2 q 18 = 2 q 9 = q  
9² = q
q = 81

5.4 SPM Practice (Short Questions)


Question 5:
It is given that R varies directly as the square root of S and inversely as the square of T. Find the relation between R, S and T.

Solution:
R α S T 2


Question 6:
It is given that P varies directly as the square of Q and inversely as the square root of R. Given that the constant is k, find the relation between P, Q and R.

Solution:

P α Q 2 R P = k Q 2 R


Question 7:
Given that P varies inversely as the cube root of Q. The relationship between P and Q is

Solution:
P α 1 Q 3 P α 1 Q 1 3


Question 8:
Given that y varies inversely as the cube of x and y = 16 when x = ½. Express y in terms of x.

Solution:
y α  1 x 3 y= k x 3 When y=16, x= 1 2 16= k ( 1 2 ) 3 16= k 1 8 k=2 y= 2 x 3


Question 9:
W varies directly with X and inversely with the square root of Y. Given that k is a constant, find the relation between W, X and Y.

Solution:
W α X Y W = k X Y W = k X Y 1 2

5.1 Direct Variation (Part 1)

(A) Determining whether a quantity varies directly as another quantity
1. If a quantity varies directly as a quantity x, the
(a) y increases when x increases
(b) y decreases when x decreases
 
2. A quantity varies directly as a quantity x if and only if y x = k  where k is called the constant of variation.
 
3. y varies directly as x is written as  y x .

4. When y x , the graph of against x is a straight line passing through the origin.


(B) Expressing a direct variation in the form of an equation involving two variables

Example 1
Given that y varies directly as x and y = 20 when x = 36 . Write the direct variation in the form of equation.

yx y=kx 20=k(36) k= 20 36 = 4 9 Find k first y= 4 9 x

5.3 Joint Variation

5.3 Joint Variation
 
5.3a Representing a Joint Variation using the symbol ‘α’.
1. If one quantity is proportional to two or more other quantities, this relationship is known as joint variation.
2.y varies directly as x and z’ is written as y α xz.
3. y varies directly as x and inversely z’ is written as y α  x z .
4. y varies inversely as x and z’ is written as y α  1 xz .

Example 1:
State the relationship of each of the following variations using the symbol 'α'.
(a) varies jointly as y and z.
(b)varies inversely as y and z .  
(c) varies directly as r3 and inversely as y.

Solution:
(a) x α yz (b) x α  1 y z (c) x α  r 3 y


5.3b Solving Problems involving Joint Variation
1. If  y α  x n z n , then y=k x n z n , where k is a constant and n = 2, 3 and ½.

2. If y α  1 x n z n , then y= 1 k x n z n , where k is a constant and n = 2, 3 and ½.

3. If y α  x n z n , then y= k x n z n , where k is a constant and n = 2, 3 and ½.


Example 2:
Given that p α 1 q 2 r when = 4, q = 2 and r = 16, calculate the value of when p = 9 and q = 4.

Solution:
Given that p α  1 q 2 r , p =  k q 2 r When p=4q=2 and r=16, 4 =  k 2 2 16 4= k 16 k=64 p =  64 q 2 r When p=9 and q=4, 9 =  64 4 2 r 9 =  4 r r = 4 9 r= ( 4 9 ) 2 = 16 81

5.1 Direct Variation (Part 2)


(C) Finding the value of a variable in a direct variation
1. When y varies directly as x and sufficient information is given, the value of y or x can be determined by using:

( a ) y = k x , or ( b ) y 1 x 1 = y 2 x 2

Example 2

Given that varies directly as x and y = 24 when x = 8, find
(a) The equation relating to x
(b) The value of when = 6
(c) The value of when = 36

Solution:


Method 1: Using y = kx

( a ) y x
y = kx
when y = 24, x = 8
24 = k (8)
k = 3
y = 3x

(b)
when x = 6,
y = 3 (6)
y = 18

(c)
when y = 36
36 = 3x
x =12


Method 2: Using y 1 x 1 = y 2 x 2

(a)
Let x1 = 8 and y1 = 24


y 1 x 1 = y 2 x 2 24 8 = y 2 x 2 3 1 = y 2 x 2 y 2 = 3 x 2 y = 3 x

(b)
Let x1 = 8 and y1 = 24 and x2= 6; find y2.


y 1 x 1 = y 2 x 2 24 8 = y 2 6 y 2 = 24 8 ( 6 ) y 2 = 18


(c)
Let x1 = 8 and y1 = 24 and y2= 36; find x2.


y 1 x 1 = y 2 x 2 24 8 = 36 x 2 24 x 2 = 36 × 8 x 2 = 12