Question 7 (12 marks):
You are not allowed to use graph paper to answer this question.
(a) Diagram 7.1 shows a solid prism with a rectangular base JKLM on a horizontal plane. The surface MQRSTL is the uniform cross section of the prism. Triangle STU and PQR are horizontal planes. Edges PJ, RS and UK are vertical. PQ = TU = 3 cm.
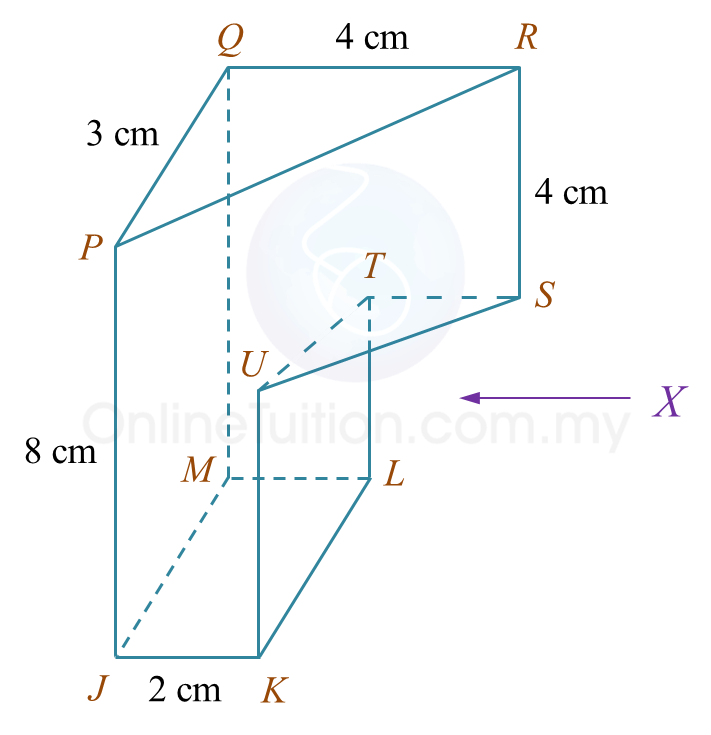 Diagram 7.1
Draw to full scale, the elevation of the solid on a vertical plane parallel to KL as viewed from X.
(b) Another solid cuboid with rectangle base JMDE is combined to the prism in Diagram 7.1 at the vertical plane JMQP. The composite solid is as shown in Diagram 7.2. The base EJKLMD lies on a horizontal plane.
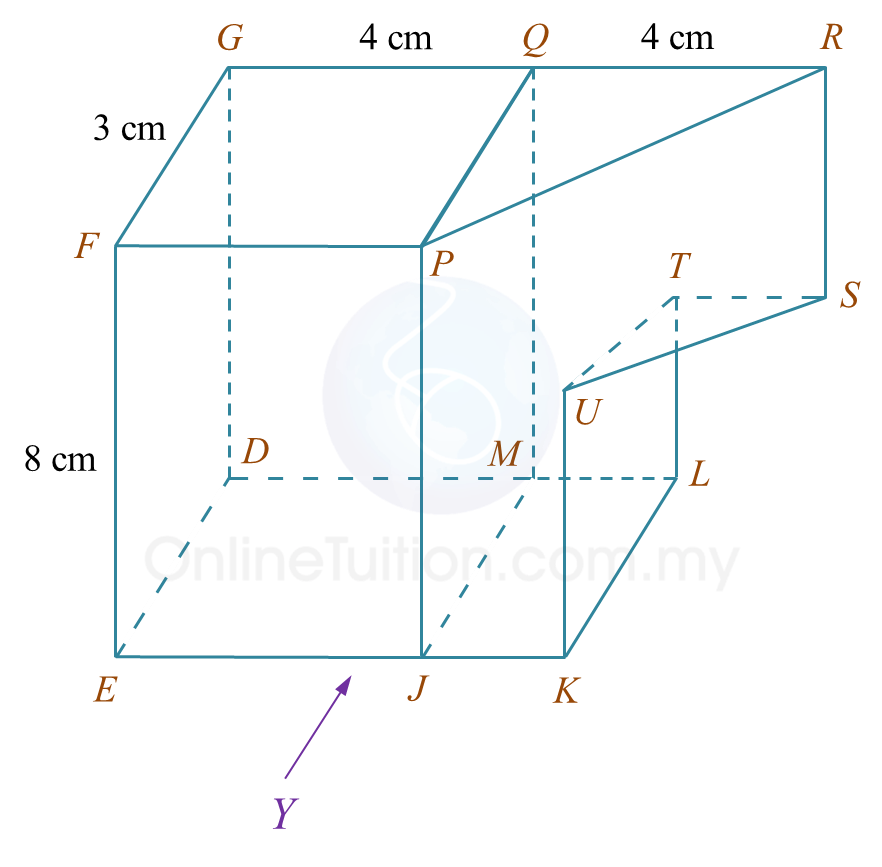 Diagram 7.2
Draw to full scale,
(i) the elevation of the composite solid on a vertical plane parallel to EJK as viewed from Y.
(ii) the plan of the composite solid.
Solution:
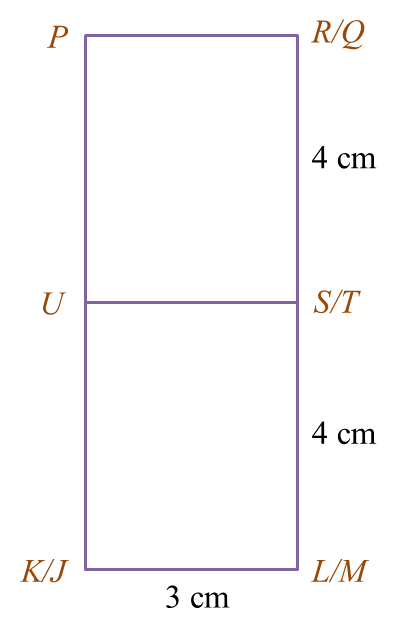
(a)
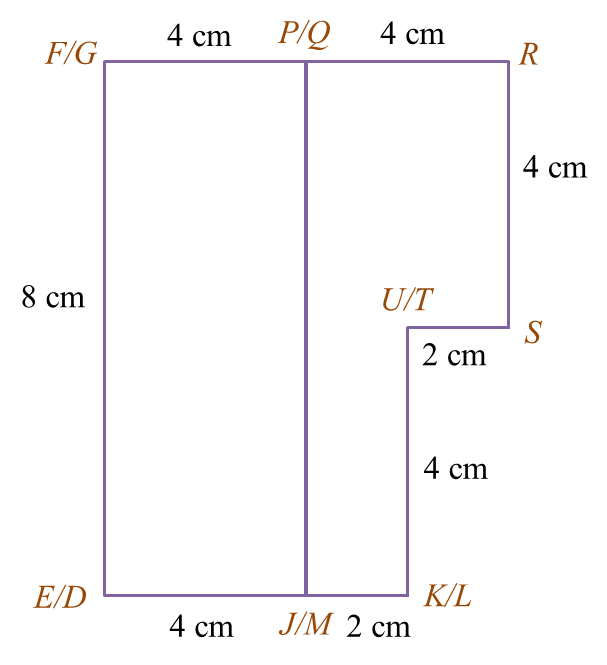
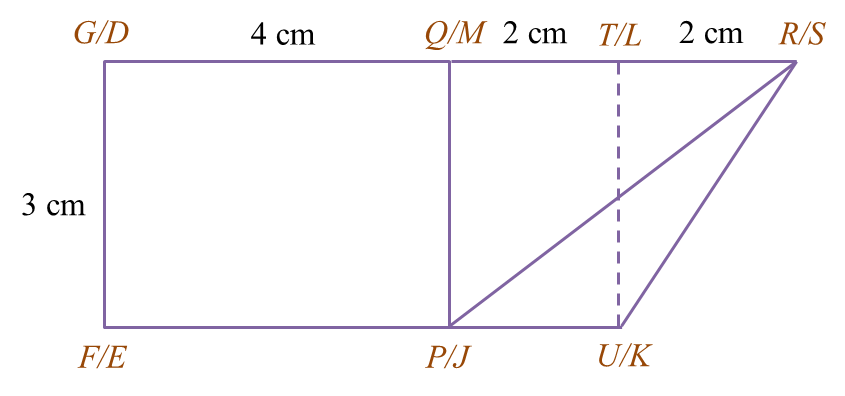
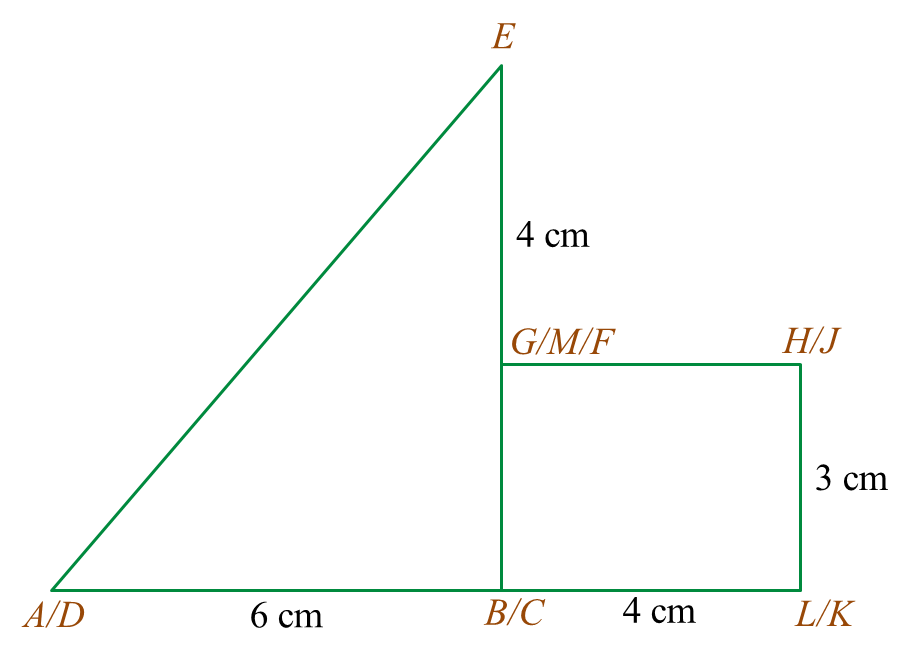
(b)(i)
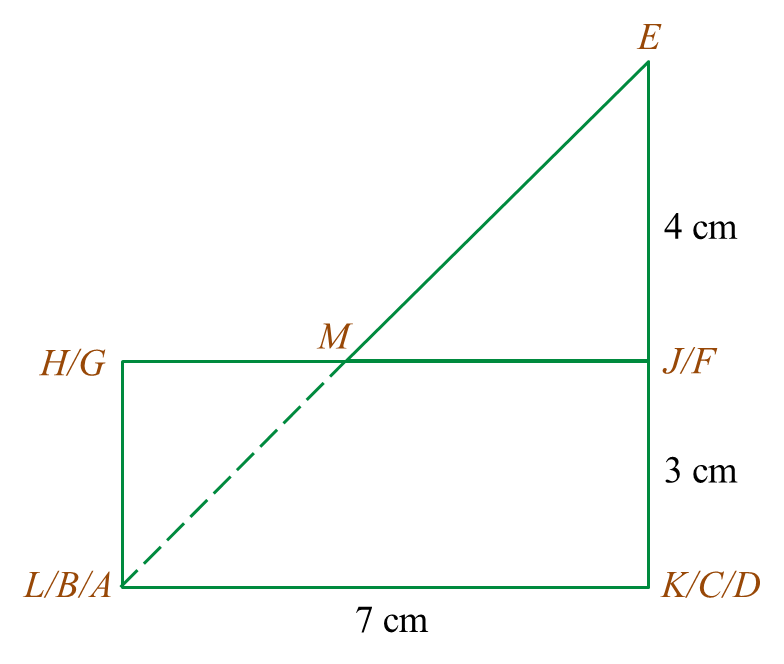
(b)(ii)
You are not allowed to use graph paper to answer this question.
(a) Diagram 7.1 shows a solid prism with a rectangular base JKLM on a horizontal plane. The surface MQRSTL is the uniform cross section of the prism. Triangle STU and PQR are horizontal planes. Edges PJ, RS and UK are vertical. PQ = TU = 3 cm.
Diagram 7.1Draw to full scale, the elevation of the solid on a vertical plane parallel to KL as viewed from X.
(b) Another solid cuboid with rectangle base JMDE is combined to the prism in Diagram 7.1 at the vertical plane JMQP. The composite solid is as shown in Diagram 7.2. The base EJKLMD lies on a horizontal plane.
Diagram 7.2Draw to full scale,
(i) the elevation of the composite solid on a vertical plane parallel to EJK as viewed from Y.
(ii) the plan of the composite solid.
Solution:
(a)
(b)(i)
(b)(ii)
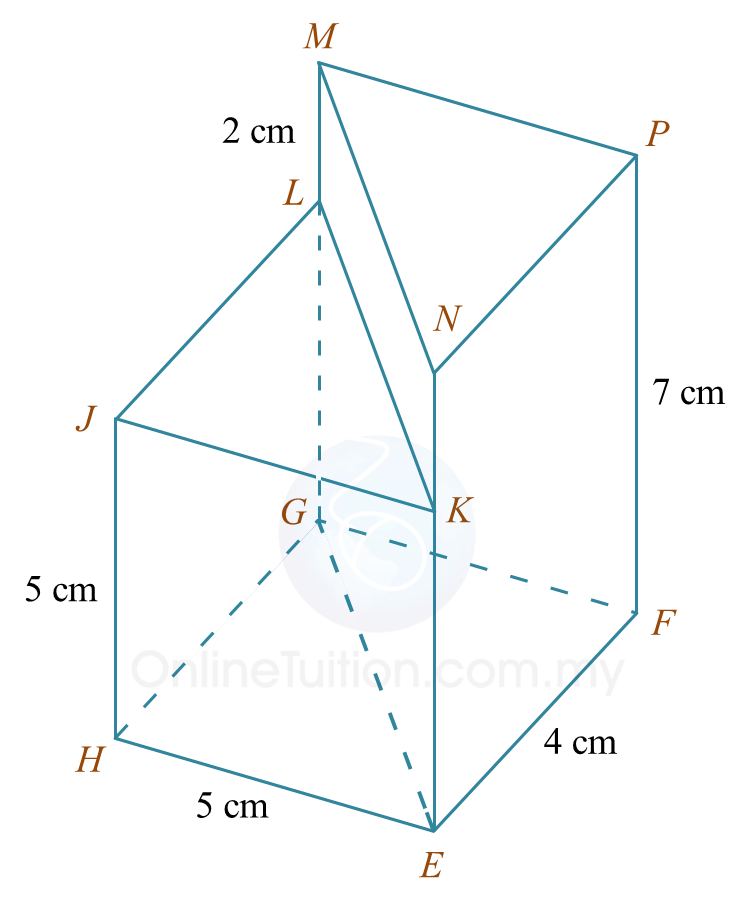 Diagram 6.1
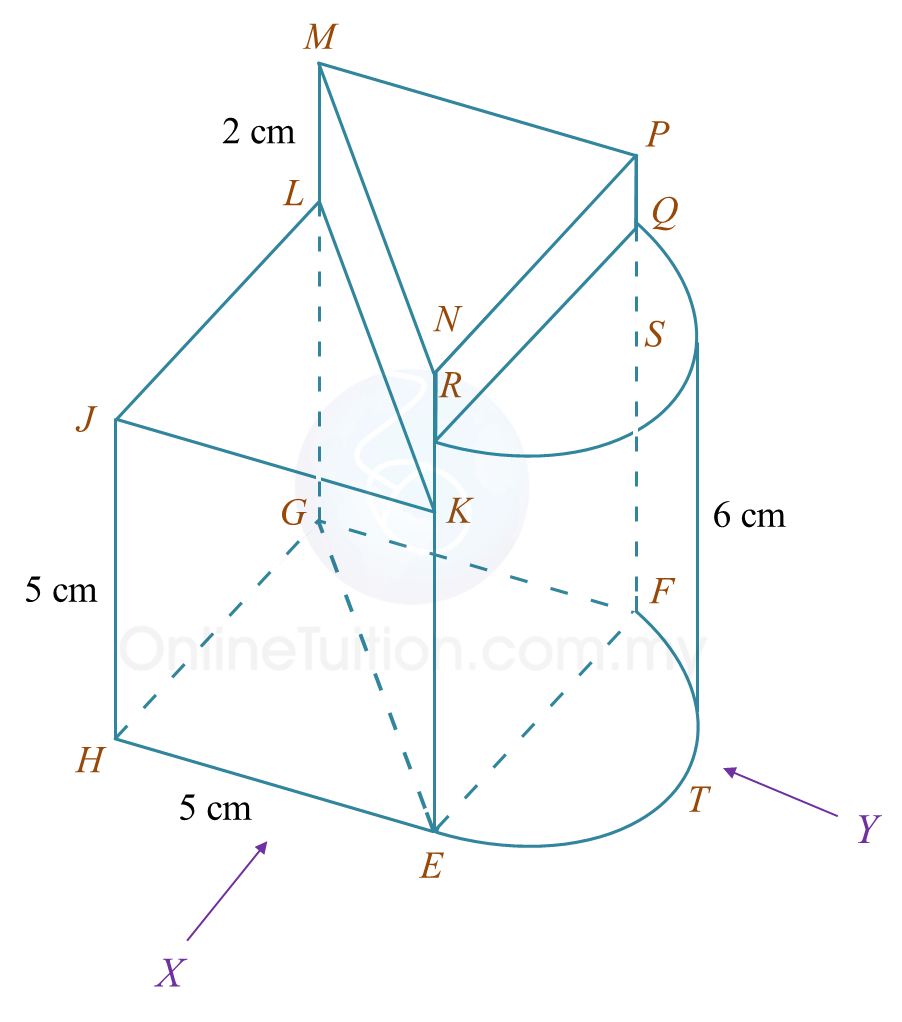 Diagram 6.2
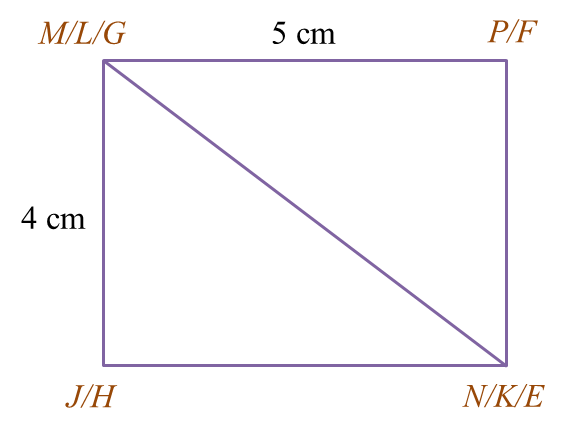
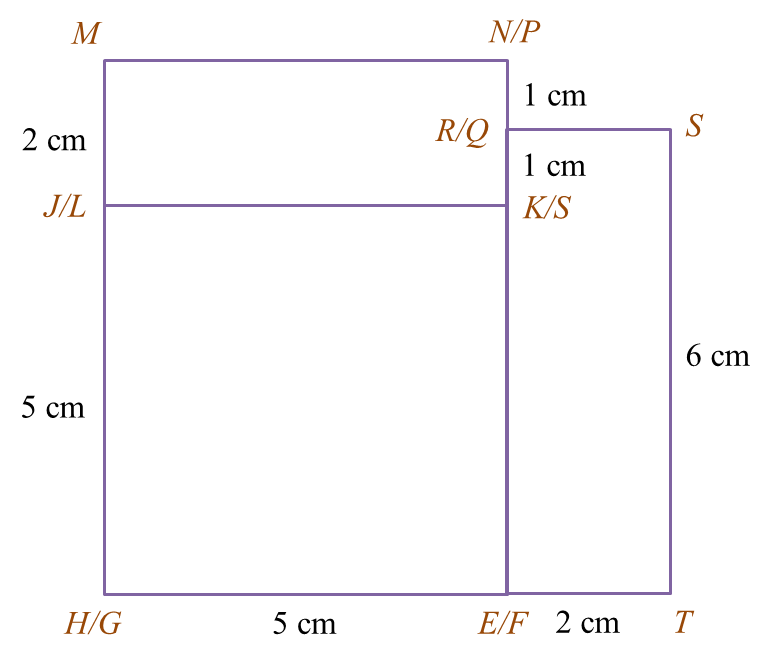
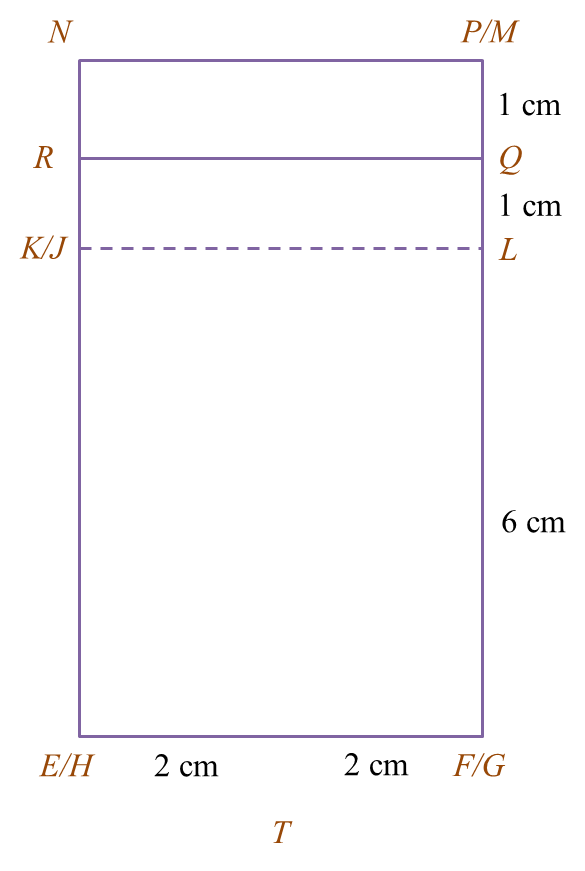
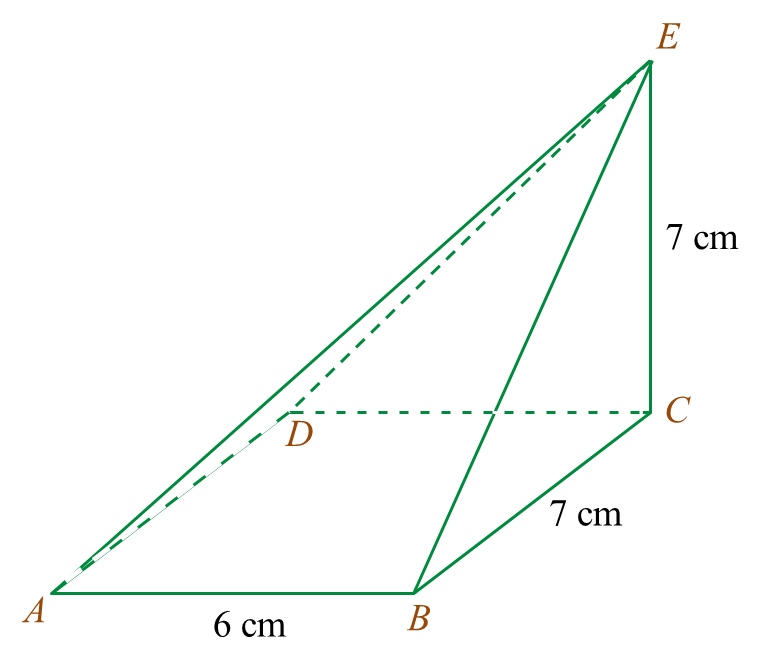 Diagram 5.1
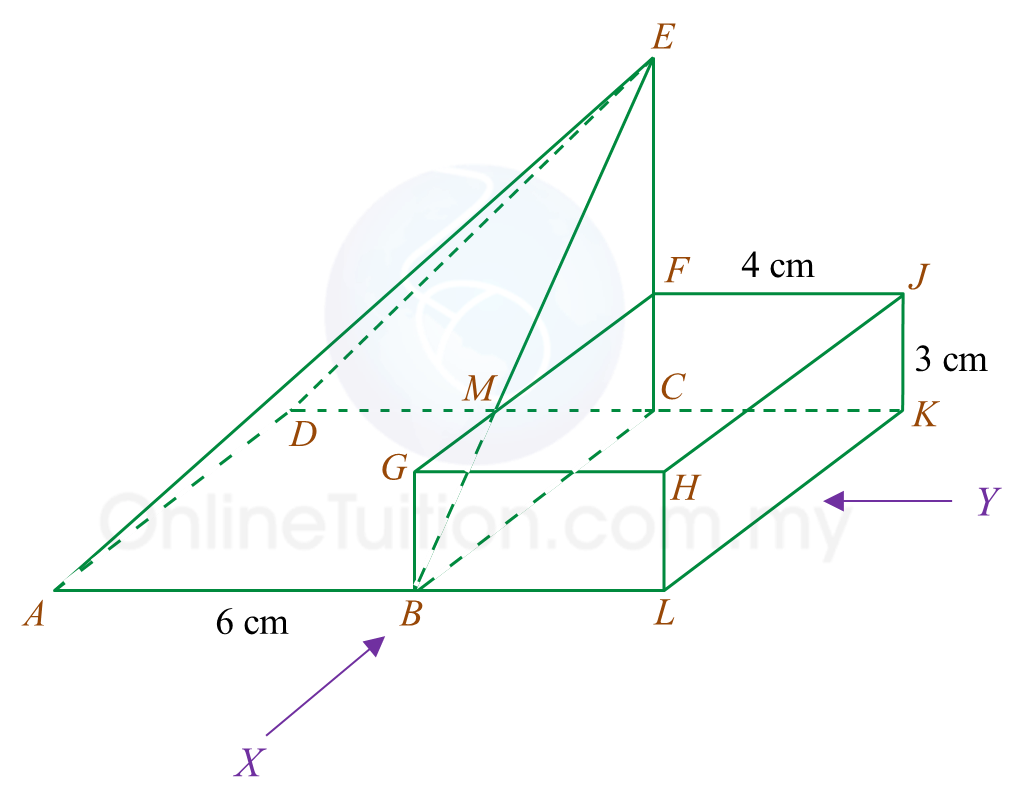 Diagram 5.2
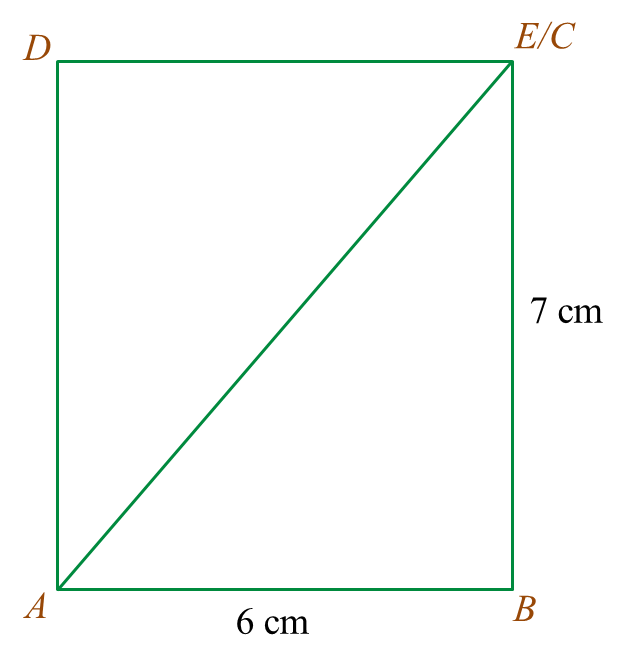
 Diagram


 Diagram


 Diagram
 Table
Table


 Diagram 11
 Diagram 12